Page 18
Find us at www.keysight.com
E-Series E9300 Average Power Sensor Specifications (Continued)
Power linearity
1
Table 9. E9300 Series power linearity (after zero and cal at ambient environmental conditions) sensor.
Sensor Power Linearity (25 ± 10 °C) Linearity (0 to 55 °C)
E9300A, E9301A, E9304A –60 to –10 dBm ± 3.0% ± 3.5%
–10 to 0 dBm ± 2.5% ± 3.0%
0 to +20 dBm ± 2.0% ± 2.5%
E9300B, E9301B –30 to +20 dBm ± 3.5% ± 4.0%
+20 to +30 dBm ± 3.0% ± 3.5%
+30 to +44 dBm ± 2.5% ± 3.0%
E9300H, E9301H –50 to 0 dBm ± 4.0% ± 5.0%
0 to +10 dBm ± 3.5% ± 4.0%
+10 to +30 dBm ± 3.0% ± 3.5%
1� After zero and calibration at ambient environmental conditions�
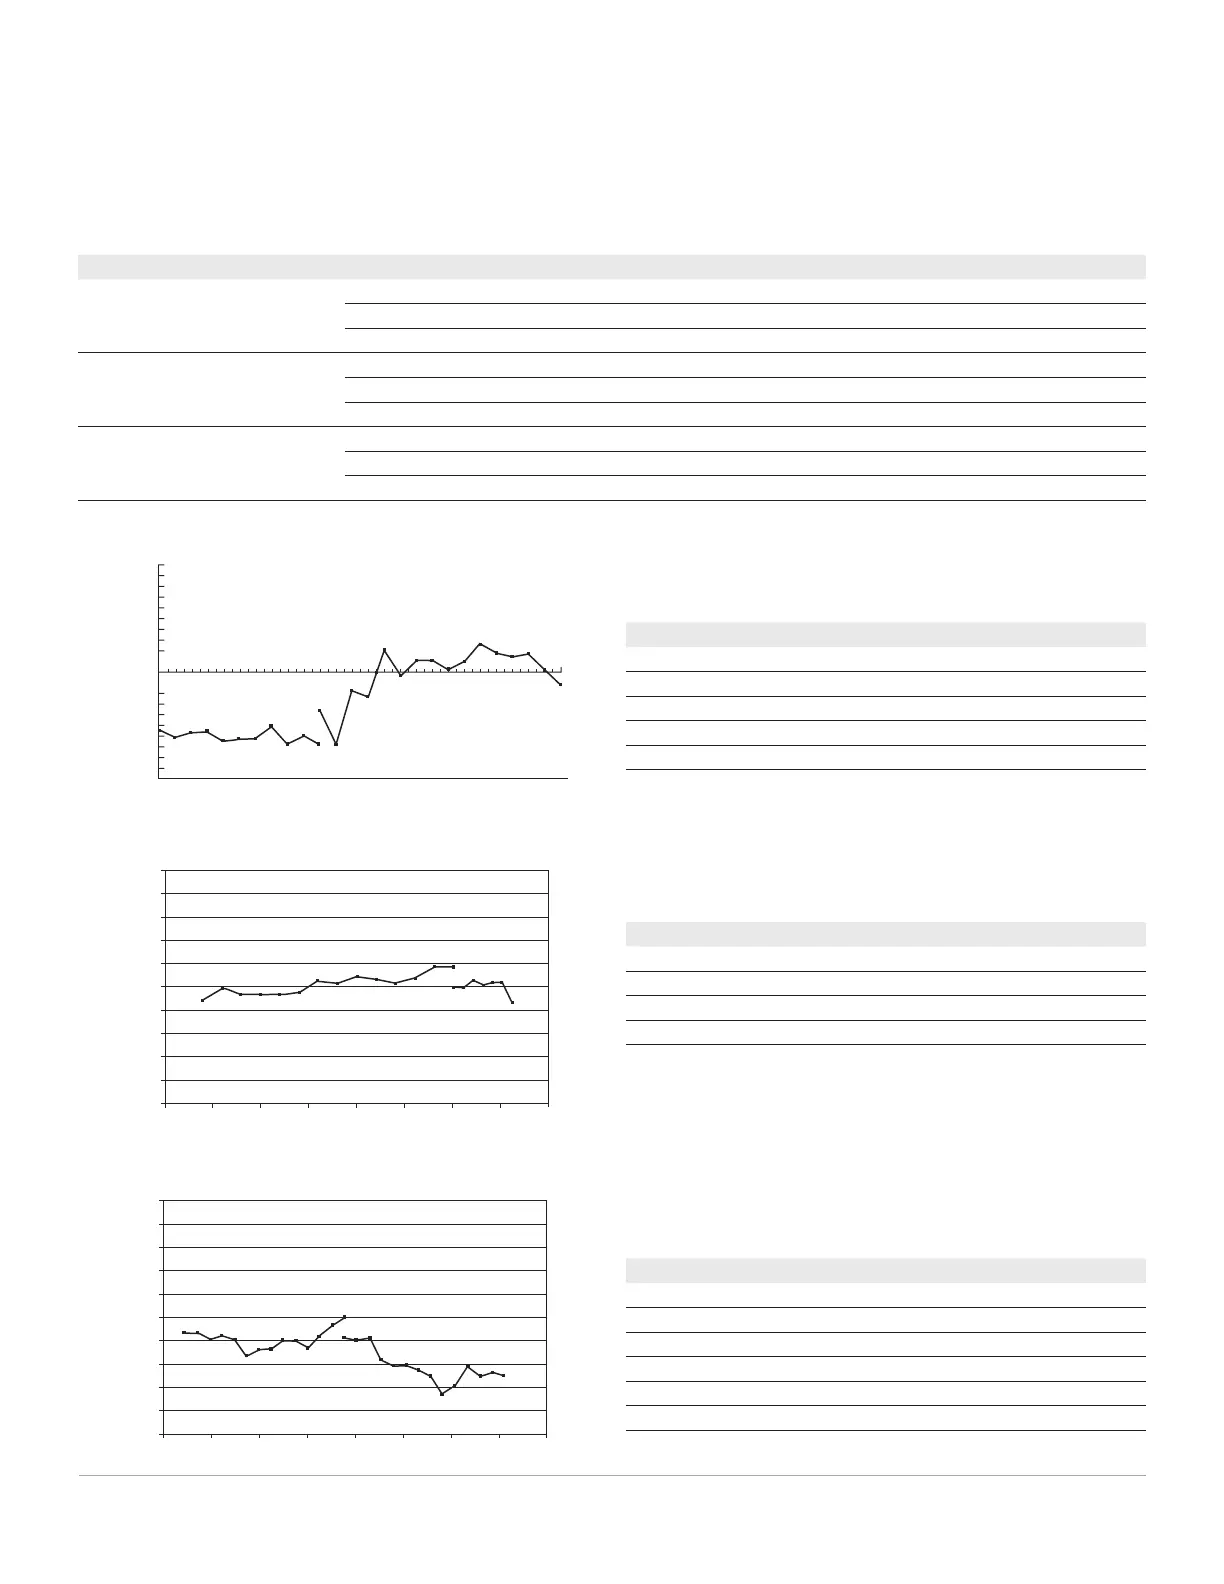
Typical E9300A/01A/04A power linearity at 25 °C, after zero and
calibration, with associated measurement uncertainty�
Power range Measurement uncertainty
–30 to –20 dBm ± 0.9%
–20 to –10 dBm ± 0.8%
–10 to 0 dBm ± 0.65%
0 to +10 dBm ± 0.55%
+10 to +20 dBm ± 0.45%
0.5
0.4
0.3
0.2
0.1
0
–0.1
–0.2
–0.3
–0.4
–0.5
% Error
18141062–2–8–10–14–18–22–26–30 20
Power (dBm)
1
0.8
0.6
0.4
0.2
0
–0.2
–0.4
–0.6
–0.8
–1
% Error
–10 –5 0 5 10 15 20 25 30
Power (dBm)
Typical E9300B/01B power linearity at 25 °C, after zero and
calibration, with associated measurement uncertainty�
Power range Measurement uncertainty
–6 to 0 dBm ± 0.65%
0 to +10 dBm ± 0.55%
+10 to +20 dBm ± 0.45%
+20 to +26 dBm ± 0.31%
Typical E9300H/01H power linearity at 25 °C, after zero and
calibration, with associated measurement uncertainty�
Power range Measurement uncertainty
–26 to –20 dBm ± 0.9%
–20 to –10 dBm ± 0.8%
–10 to 0 dBm ± 0.65%
0 to +10 dBm ± 0.55%
+10 to +20 dBm ± 0.45%
+20 to +26 dBm ± 0.31%
1
0.8
0.6
0.4
0.2
0
–0.2
–0.4
–0.6
–0.8
–1
% Error
–10 –5 0 5 10 15 20 25 30
Power (dBm)
 Loading...