LCDPDP
Measuring diameter
viewed through
viewnder
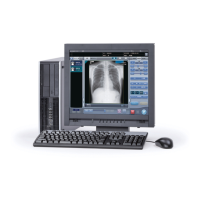
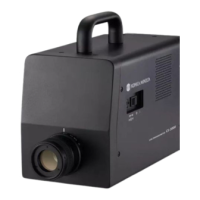
System Conguration
Measuring distance vs. measuring area (Units: mm)
Measuring distance
Measuring angle
1° 0.2° 0.1°
When a close-up lens
is attached
55.0 ø1.00 ø0.20 ø0.10
70.9 ø1.39 ø0.28 ø0.14
350 ø5.00 ø1.00 ø0.50
500 ø7.78 ø1.56 ø0.78
1,000 ø16.66 ø3.33 ø1.67
2,000 ø34.18 ø6.84 ø3.42
* The measuring distance is the distance from the objective lens or the end of the metal frame
of the close-up lens.
High repeatability achieved by an instrument design which thoroughly eliminated mechanical and electrical noise factors.
1° is suitable for
Typical targets such as middle- and
large-size display units
• LCD, PDP, or EL display panels
• LCD p anel s of cellu lar phones and
digital cameras
• Radar and other instrument panels
used in airplane cockpits
• Large outdoor display screens
0.2° is suitable for
Small light sources such as LEDs
• Car audio systems
• Instrument panels for automobiles
• Lamps, fluo resce nt tube backlights,
and other light sources
0.1° is suitable for
Extremely small light sources or
distant lights
• PDP or LCD pixels
• Cold-cathode tubes
• Brake lamps of automobiles
• Traffic signals
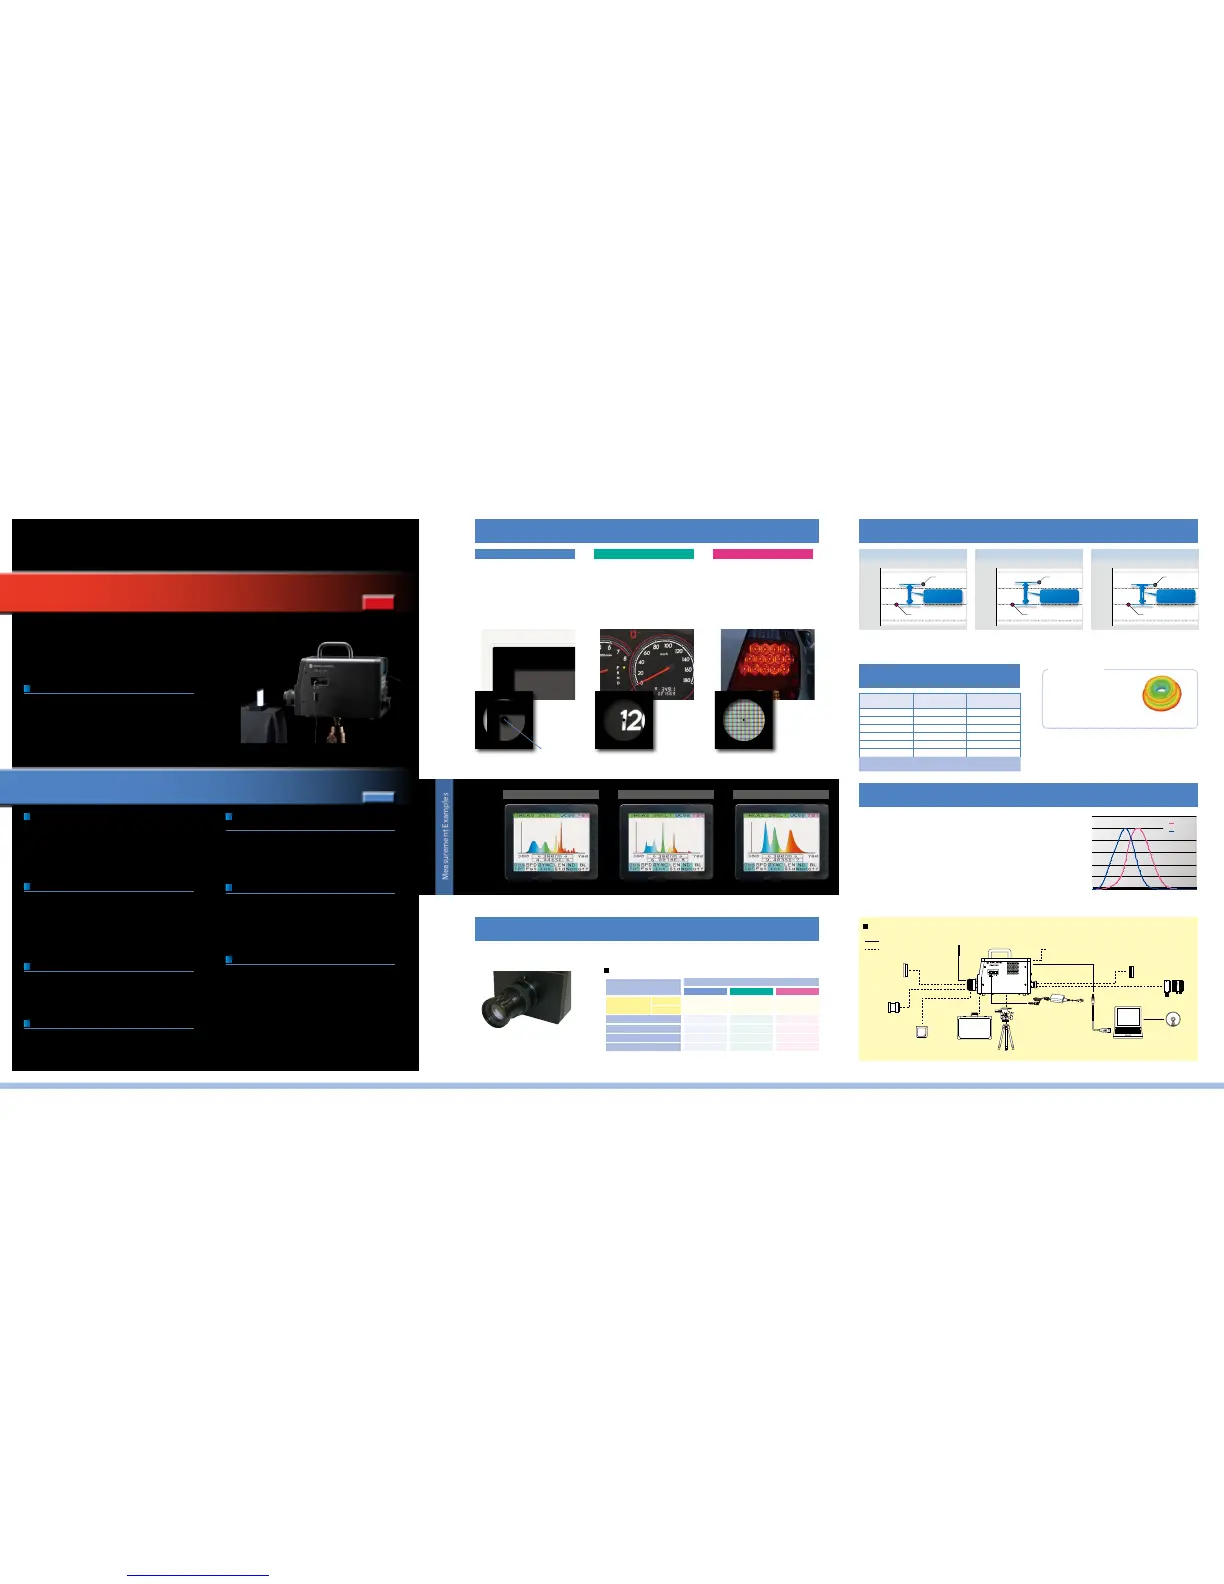
Optional close-up lens allows measurements of areas as tiny as ø0.1 mm. Not only general display units but also small
targets can be measured.
It is known that the sensitivity of human vision shifts to blue region in dark
environments, but past instruments did not have scotopic measurement
function. CS-2000A achieves sufcient capability to make it possible with
CS-S10w Professional (standard accessory).
Scotopic vision
In the human eye, there are 2 types of photoreceptor cells, which are cone cells and rod
cells. Cone cells are sensitive to color and rod cells are sensitive to only brightness.
As brightness decreases, the activity of rod cells becomes stronger, and the condition
in which only rod cells are working is called scotopic vision. The peak of spectral
luminous efficiency of scotopic vision is shifted toward blue from the green peak of
photopic vision (vision under brighter conditions) and thus blue objects are perceived to
be brighter.
Measurements of various objects are possible by selecting
the best-suited measuring angle.
Measured luminance vs. Measurement times
(Units: sec.)
Scotopic vision measurement
Close-up lens for measurement of even tinier areas
(Optional accessory)
Comparison of
repeatability
* Comparison with Konica Minolta's previous model CS-1000 for target luminance of 0.1 cd/m
2
* The y-axis indicates the logarithm when the average of the CS-2000 measured values is assumed to be 1.
Luminance (cd/m
2
) NORMAL mode FAST mode
0.003 243 35
0.01 243 35
0.1 155 27
1 19 5
10 4 4
300 3.7 3.7
Measurement subject: Standard light source A
* All time indications are approximate values.
Thermal analysis diagram
of the sensor block
The o ptic al sen sor, which is the
heart of the CS-2000, was designed
through precise analysis in order to
eliminate the influenc e of thermal
distortion of its components on the
measurement values.
World's top level capability to detect extremely
low luminance
* As a polychromator type spectroradiometer (As of March 2009)
1,000,000:1 contrast measurement is now possible!
* When the peak luminance is 500 cd/m
2
Opening the curtain on a new age in which people can experience theater ambiance with their home televisions.
The Spectroradiometer CS-2000A enables high-accuracy mega-contrast measurements of the extremes from delicate
shadows to glittering wavefronts which are key to image reproduction performance.
This newest addition to the Konica Minolta Sensing lineup will contribute greatly to
research and development as well as quality control of the most advanced FPDs.
0.0005 cd/m
2
opens new worlds
With an additional decimal place of performance in
measuring low luminosity even compared to our CS-2000,
which was awarded the ADY 2008 grand prize, the CS-
2000A helps open up a new stage of display development by
enabling the measurement of contrast ratios up to 1 million to
1*1 which is being targeted by the latest FPD technology.
*1 Maximum luminance 500 cd/m
2
Highly accurate measurement of luminances as
low as 0.003 cd/m
2
Konica Minolta's original optical design and signal-processing
technologies provide accurate measurement of luminance/
chromaticity down to extremely low luminances of 0.003 cd/m
2
.
Low-luminance measurements: From 0.003 cd/m
2
Measurement accuracy: ±2% (Luminance)
Quick measurements even at low luminance
Designed to thoroughly eliminate mechanical and
electrical noise factors, the CS-2000 makes quick
measurements with good repeatability possible even at
low luminance levels.
Measurement time for 1 cd/m
2
:
Approx. 5 sec. (FAST mode)
* Konica Minolta's previous model CS-1000: Approx. 123 sec.
Low polarization error
The polarization error generated when using a reflection-
type diffraction grating has been minimized to 2%
(measuring angle: 1°). This ensures more stable
measurements of display devices that use polarization,
such as LCDs.
Half bandwidth of 5 nm
A half bandwidth of 5 nm, which is required for colorimetry
(JIS Z 8724-1997, CIE122-1996), is ensured for the
entire wavelength range, allowing accurate chromaticity
measurements.
Measurement example:
Measurement of an organic EL illumination panel during development
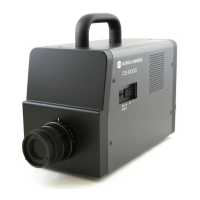
CS-2000
NEW
CS-2000A
Selectable measuring angle for measurement of
tiny areas
The CS-2000 enables you to select the optimum measuring
angle according to the application.
Measuring angle selection: 1°, 0.2°, 0.1°
Minimum measuring area: ø0.1 mm ( when the optional close-
up lens is attached)
Practical design
• The operating temperature range of 5 to 35°C ensures
relia bl e op er ation at temper at ures in ac tual work
environments.
• Measurement can be started after a warm-up time of only
30 seconds. (Measuring angle: 1°; Target luminance:
5 cd/m
2
or more; 23°C)
Stable measurement even of periodic light sources
1. Internal synchronization measurement
Measurement at numerically-input frequency
2. External synchronization measurement
Measurement with line input of vertical synchronization
signal to instrument
3. Multi-integration mode measurement
Measurement for reducing variations due to unsynchronized
measurements or synchronized measurements of sources
having irregular light-emission cycles
Instruments that push the extreme boundaries of practical application and
cost performance to support design and development work.
Technology
 Loading...