The lens displays an entrance slit in the spectral components of the input light to the camera sensor. The camera
record can be used as a current source of information or for analysis without the use of a camera after saving
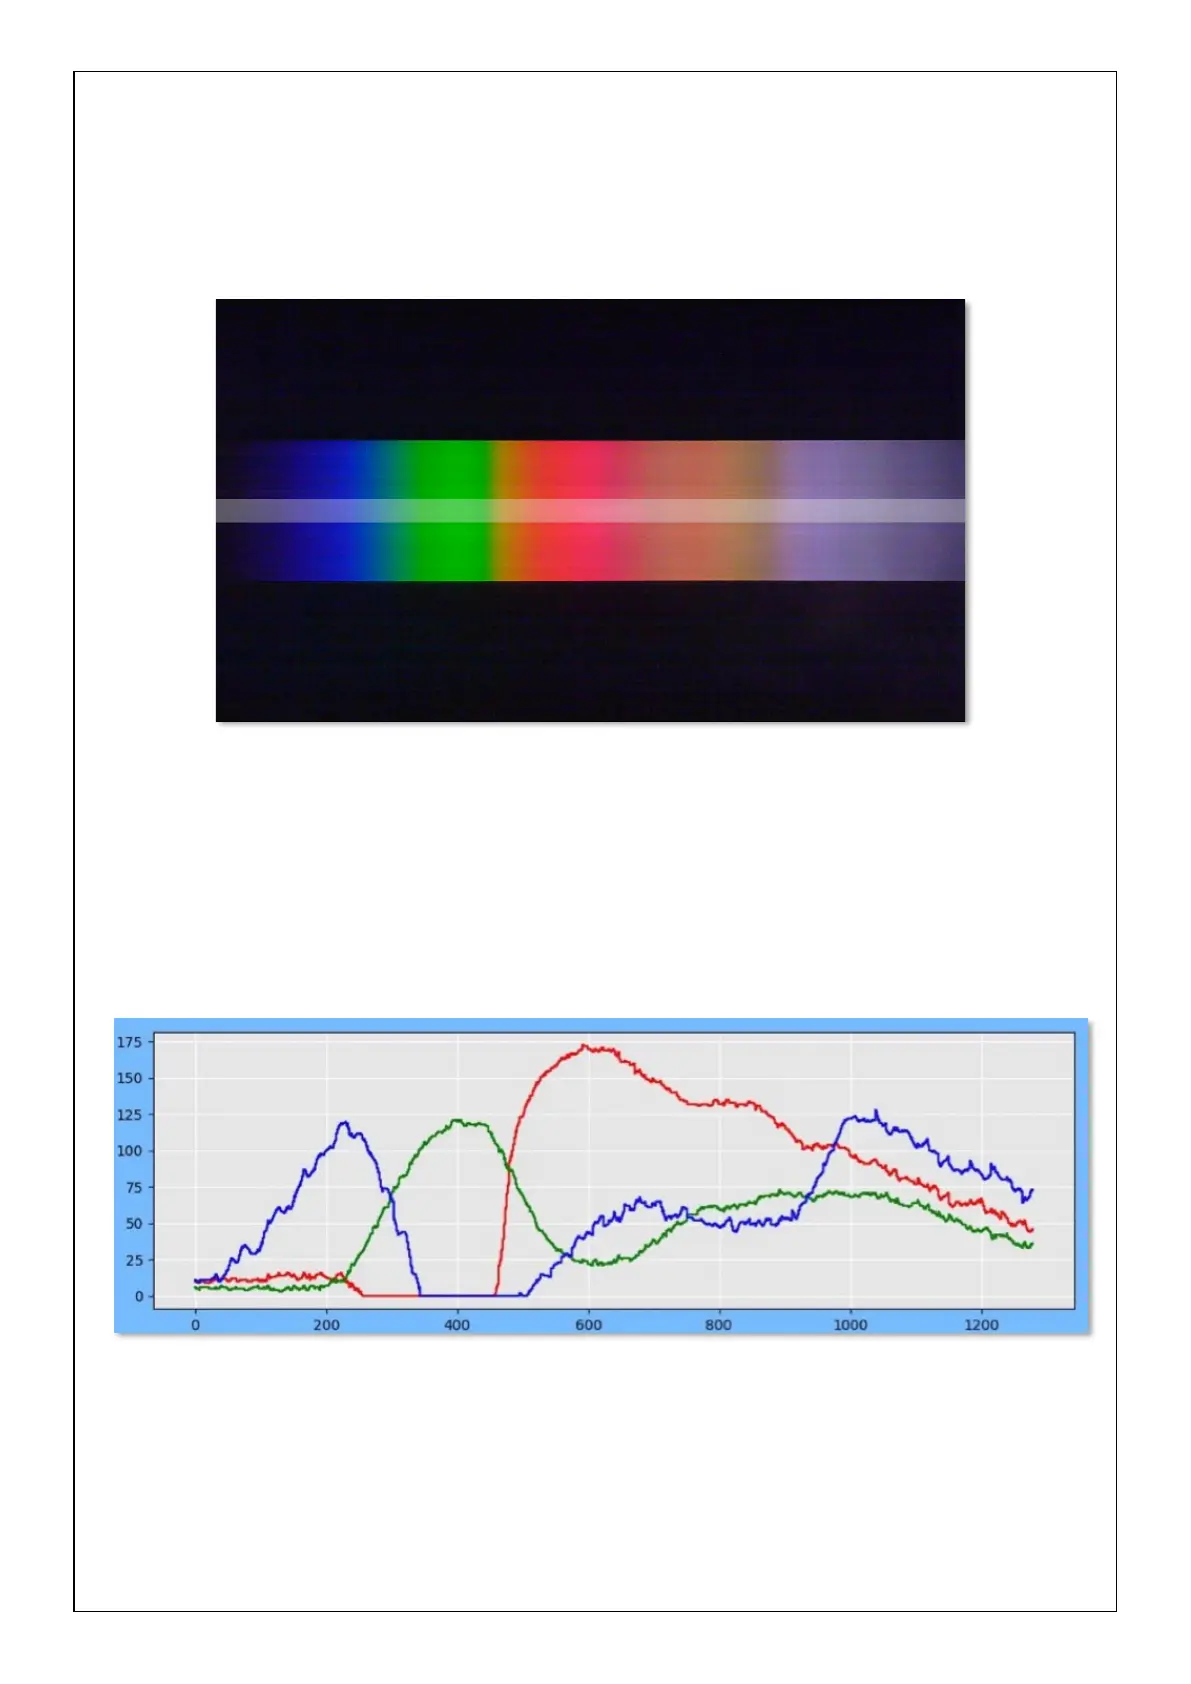
in image format. The height of the spectrum corresponds to the enlarged image of the entrance slit and it is the
same for each spectral component. The spectrum covers approximately 1/3 of the camera recording area. The
part of the record highlighted with a white strip is graphically evaluated. Its position and width can be selected
in the software (spectrometer control).
The SPECTRA spectrometer from KVANT is intended for teaching and qualitative analysis of spectral
properties of various types of substances and light sources.
As the light detector, a CMOS sensor with an RGB colour registration is used. It generates R, G, and B signals
with values between 0 and 255 (8-bit digitalization of the electrical signal level. The advantage is an acceptable
price and a suitable communication protocol for processing the measured data.
The graph below (the light intensity versus pixel number) shows the RGB outputs of the Spectrometer when
recording the spectrum of a white light source.
For creating a final spectrum, the total light output is interpreted as the maximum value of maxRGB components
R, G, and B. This may be seen as a limitation of this measurement technique because the final spectrum is not
smooth but has “valleys” as shown on the graph below. It can be removed by mathematical adjustment
(correction in the spectrometer control section).