USER INTERFACE
THE MAIN SCREEN
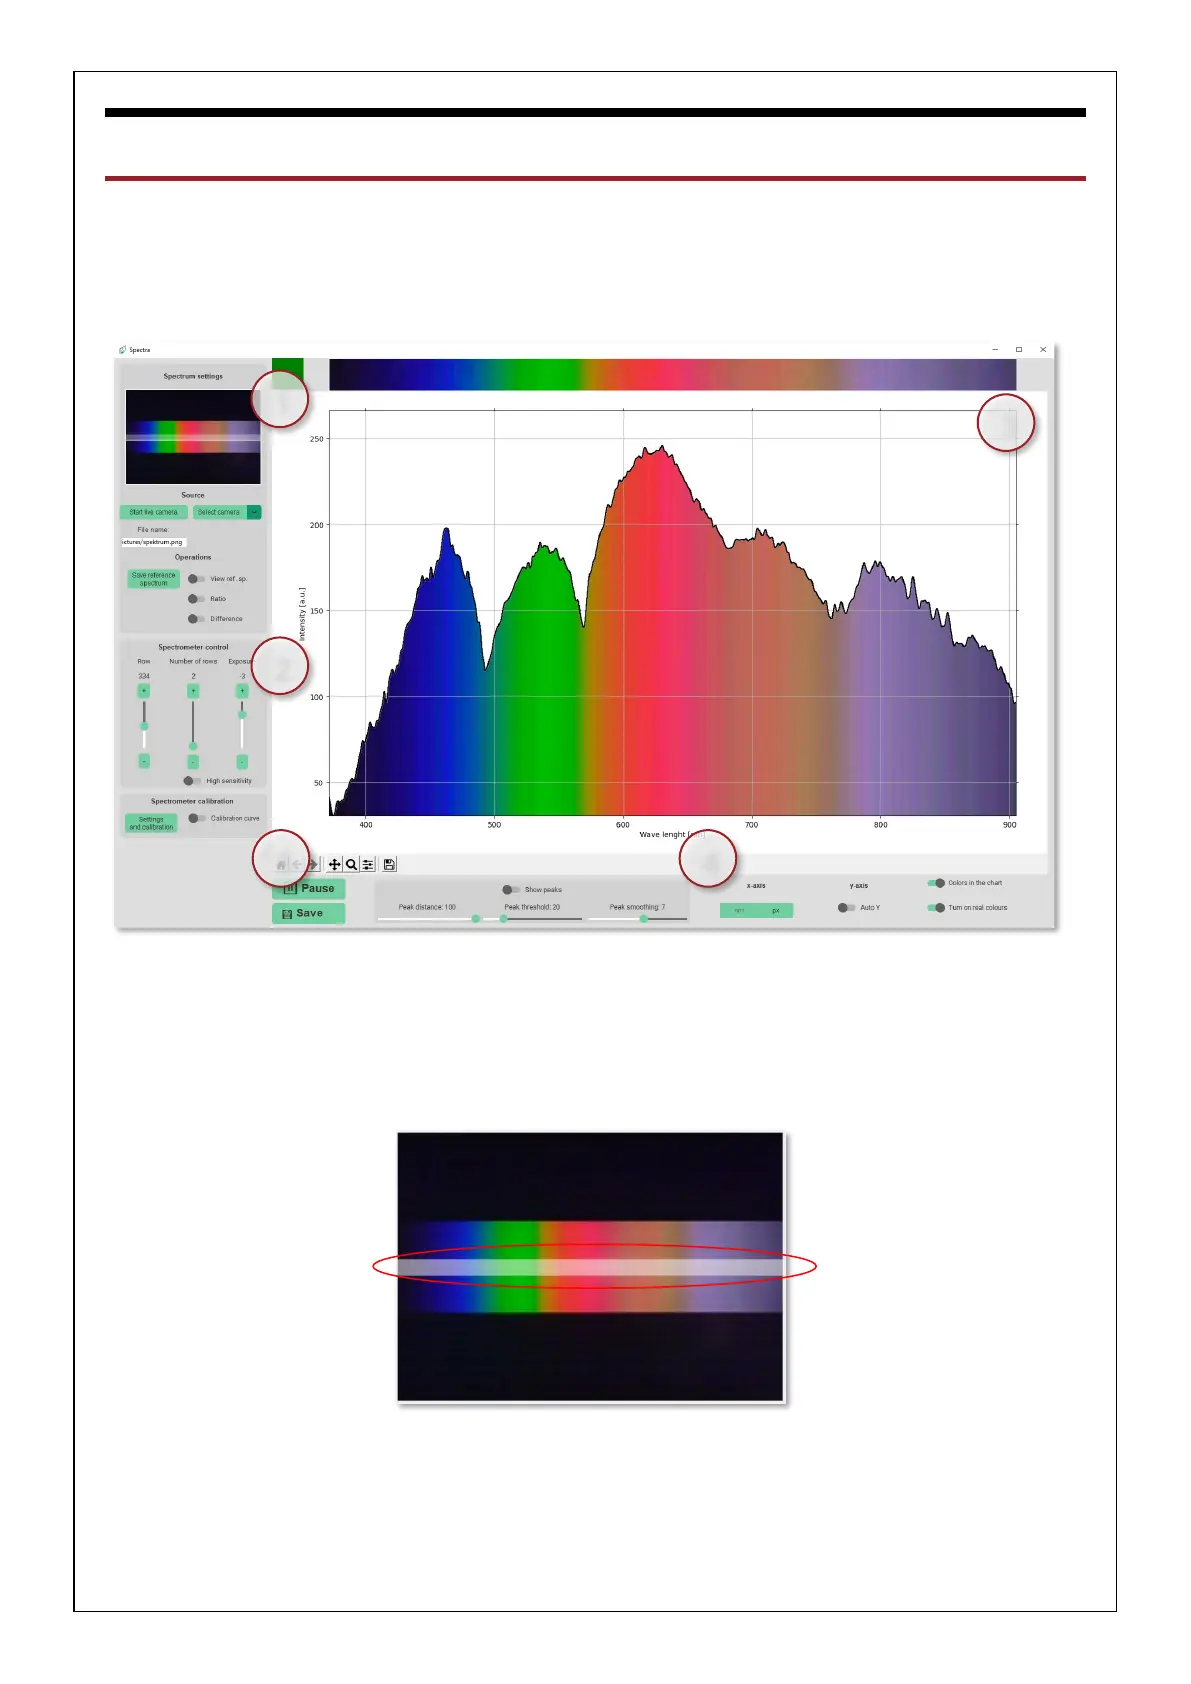
The main screen consists of several sections: 1 Spectrum Setup, 2 Spectrometer Control, 3 Graph, 4 Graph
Settings, 5 Spectrometer Calibration.
Application user interface
1 SPECTRUM SETUP
On the left side of the application is a preview window where the current record from camera or folder is
displayed. The position and width of the selection for graphic display are visible.
Selected part of the current record with saturation signalization of graph is displayed at the top of the
application. When the signal is oversaturated, it changes colour to red.