238
8 CO/O
2
Control
Threshold signal/optimisation point
A graphical representation of the behaviour during CO detection can be found in chapter Fig.
8-29 Parameter CO- controller - Behaviour during CO detection.
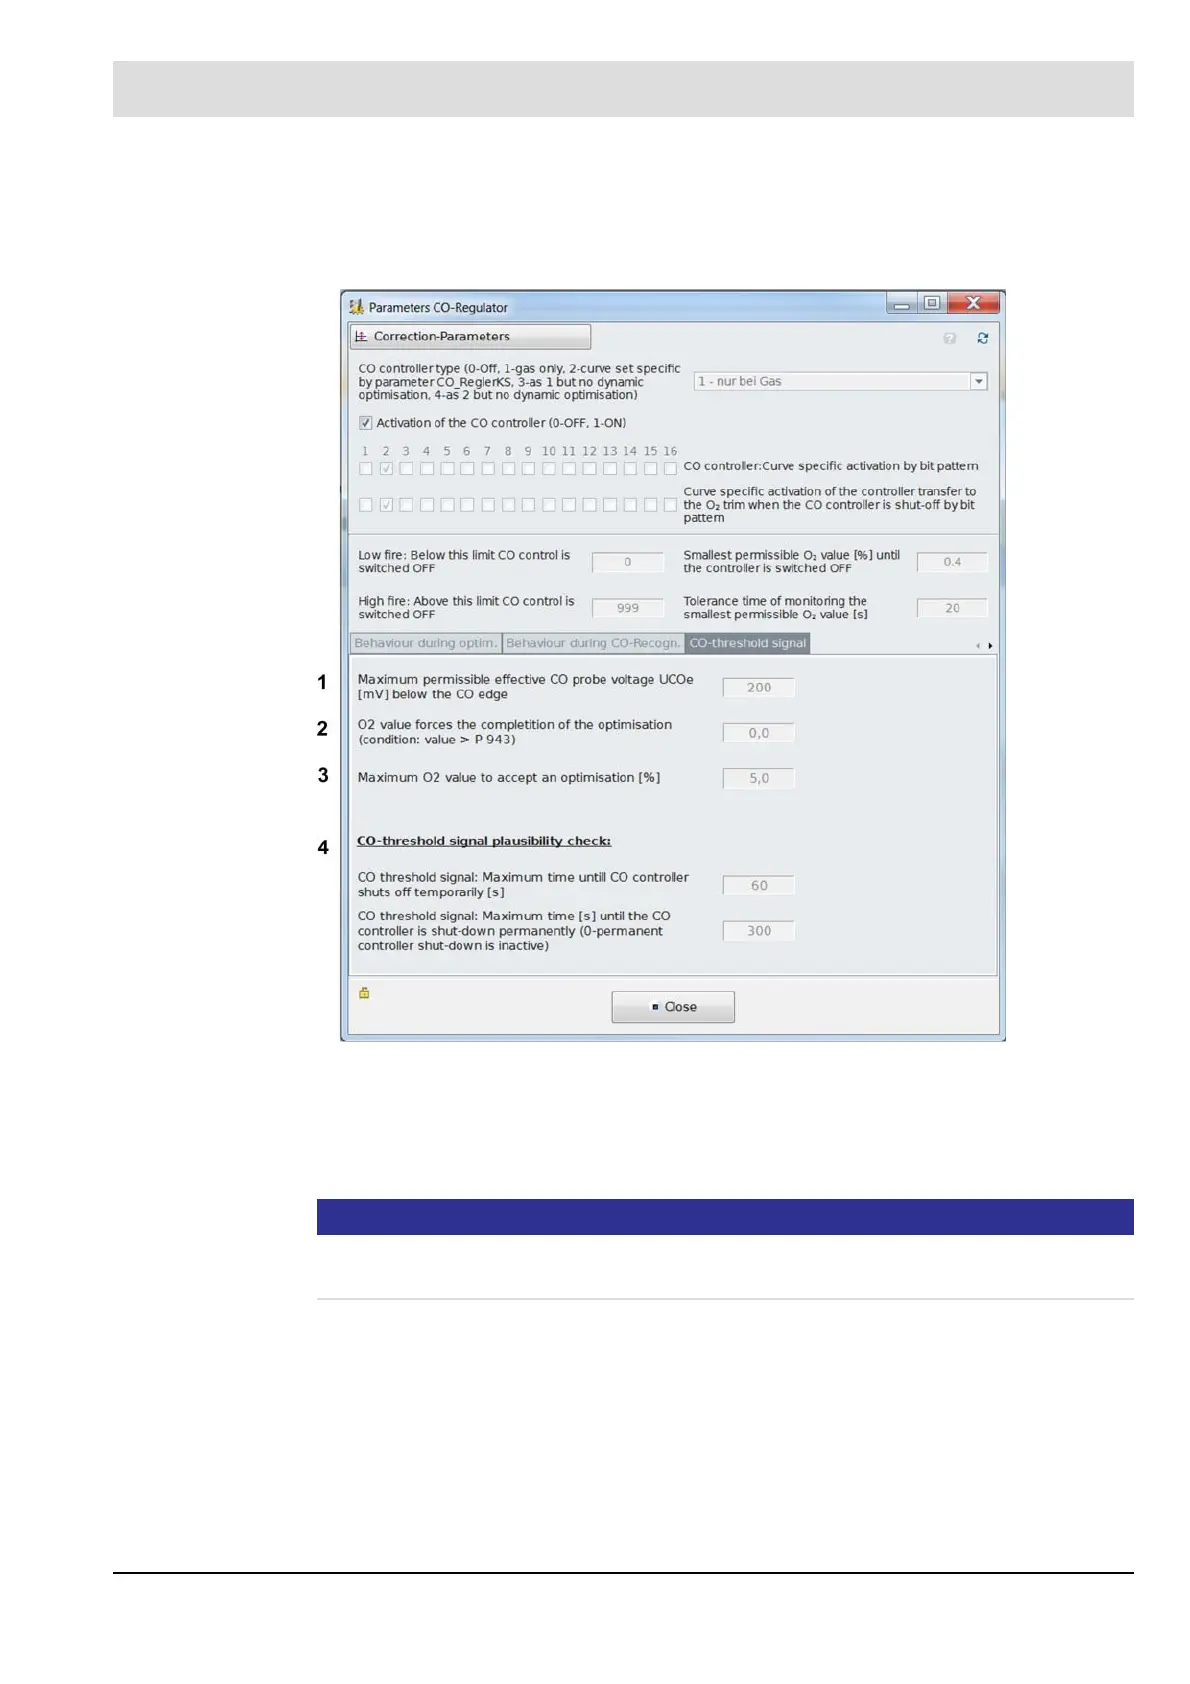
Fig. 8-30 CO threshold tab
NOTICE
If the CO
e
probe dynamic test is active, this value can be undershot.
This value is not controlled, therefore lower O
2
values are possible.
1 Maximum permissible effective U
COe
[mV] below the CO edge
In addition to the binary edge signal, the CO edge is also evaluated as exceeded if
U
COe
has exceeded the threshold value set in P 234.
2 O
2
value [forces the completion of the optimisation (condition: value > P235)
When the O
2
value in P 235 is reached in 0.1%, the optimisation is forcibly com-
pleted. When the O
2
value in P 235 is reached in 0.1%, the optimisation is forcibly
completed. During the dynamic test the value can be undershot!
3 Maximum O2 value to accept an optimisation [%]
The optimisation is only completed and the new point entered in the CO optimisation
curve if the current O
2
value is smaller than the parameter set threshold value in
P 236. O
2
values above this threshold value are not entered in the visualisation curve