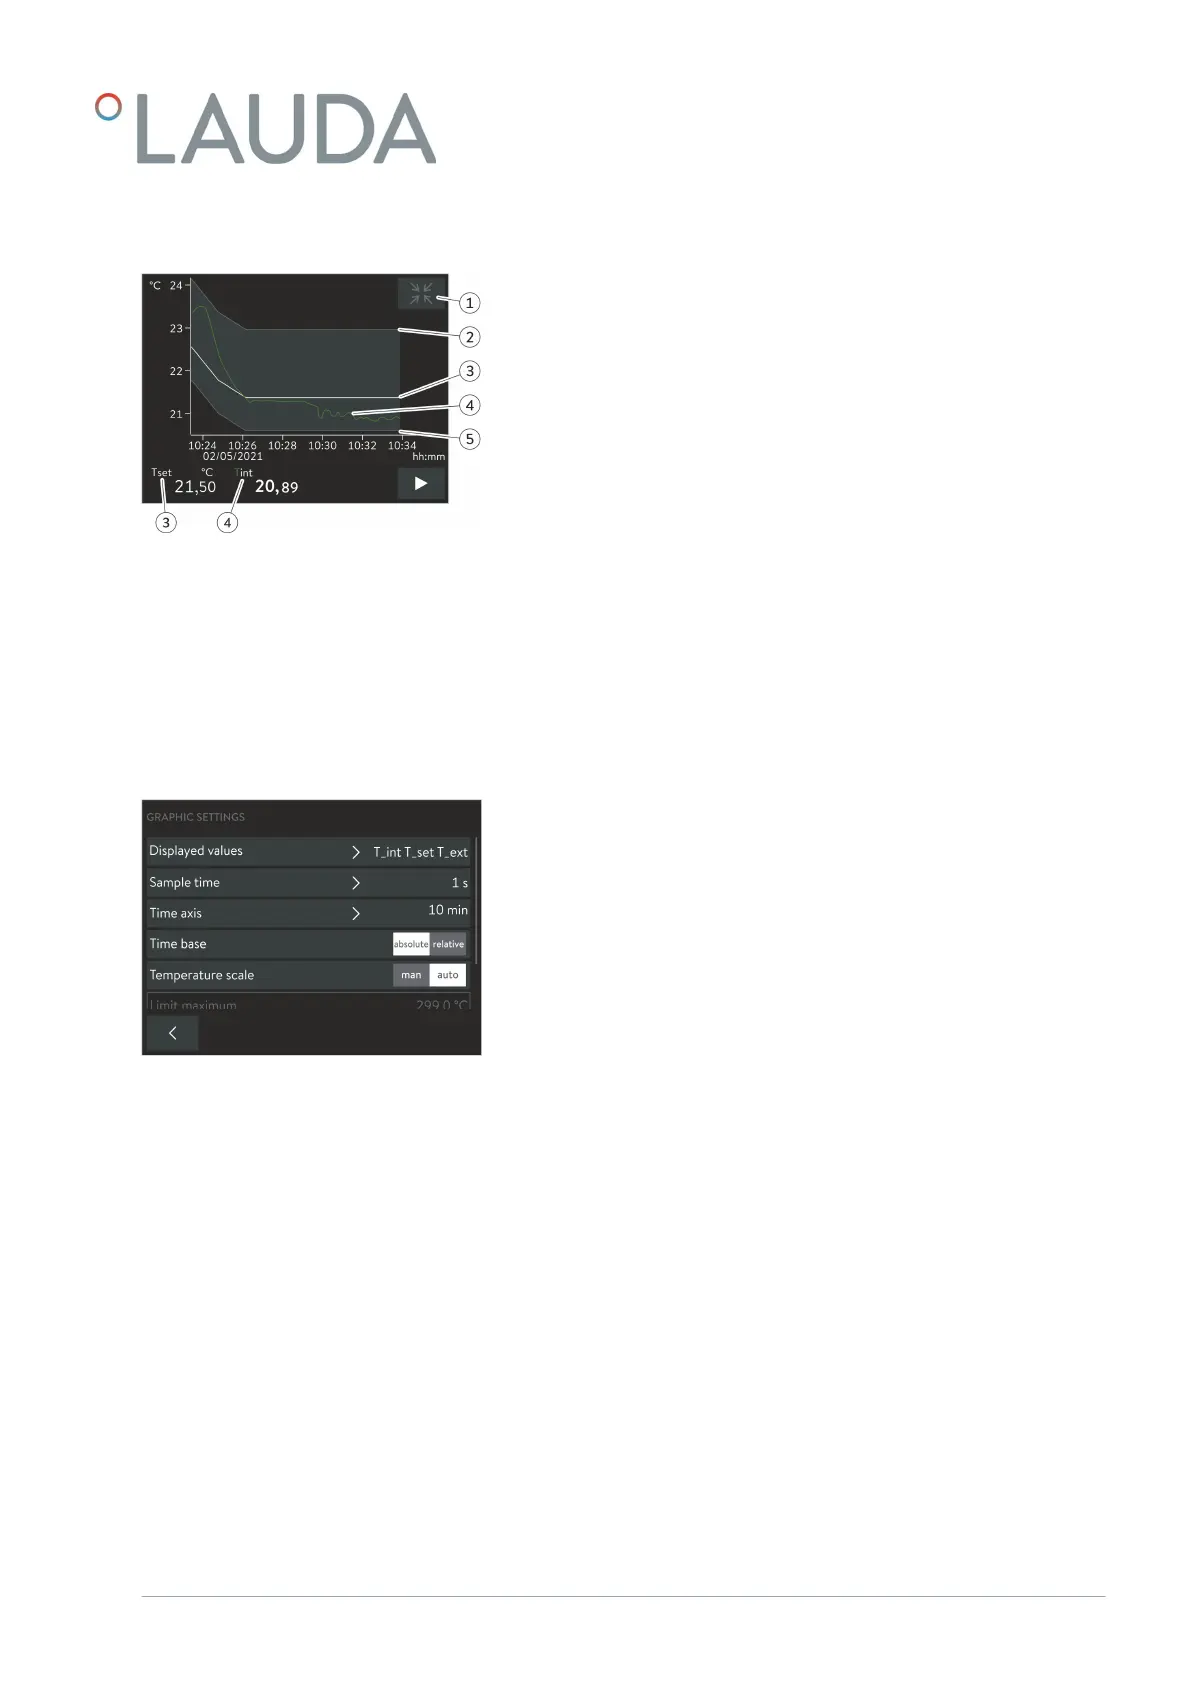
1 [Minimize] icon
2 Maximum limit value
3 Set temperature
4 Internal actual temperature profile
5 Minimum limit value
1. Open the Home window.
2.
Touch the Settings Graphic settings tile.
The Graph settings submenu opens.
The graph window can be adjusted if necessary with the following settings:
[Displayed values]: T
set
, T
int
and T
ext
Here you can define which temperatures are displayed in the graph.
[Sample time]: 1, 5, 10 or 30 seconds
Here you can define the time interval at which new temperature values
are measured.
[Time axis]: 1, 10, 30, 60 or 120 minutes as well as 12 or 24 hours.
Here you can define the time range displayed in the visible graph window
(corresponds to scaling of x axis).
[Time base]: Slide switch for absolute and relative settings
When Absolute
is selected, measurements are recorded with the
current time.
When Relative is selected, measurements are recorded from the
start time "00:00:00".
[Temperature scale]: Slide switch for the manual and automatic settings
Here you can define the temperature range displayed in the visible
graph window (corresponds to scaling of y axis).
If the slide switch is set to automatic, the size of the visible graph
window adapts automatically when the temperature curves change.
If the slide switch is set to automatic, the two buttons below (limit
value) are disabled.
Structure of the graph window
Fig. 10: Graph window with temperature
profile
Adjusting the graph window
Fig. 11: Graphic settings
V1 Command Touch operating unit 17 / 51