'XHWRRXUSROLF\RIFRQWLQXRXVSURGXFWLQQRYDWLRQVRPHVSHFL¿FDWLRQVPD\FKDQJHZLWKRXWQRWL¿FDWLRQ
©/*(OHFWURQLFV86$,QF(QJOHZRRG&OLIIV1-$OOULJKWVUHVHUYHG³/*´LVDUHJLVWHUHGWUDGHPDUNRI/*&RUS
32 | MULTI F OUTDOOR UNIT
Multi F and Multi F MAX Heat Pump System Engineering Manual
MULTI
F
MAX
MULTI
F
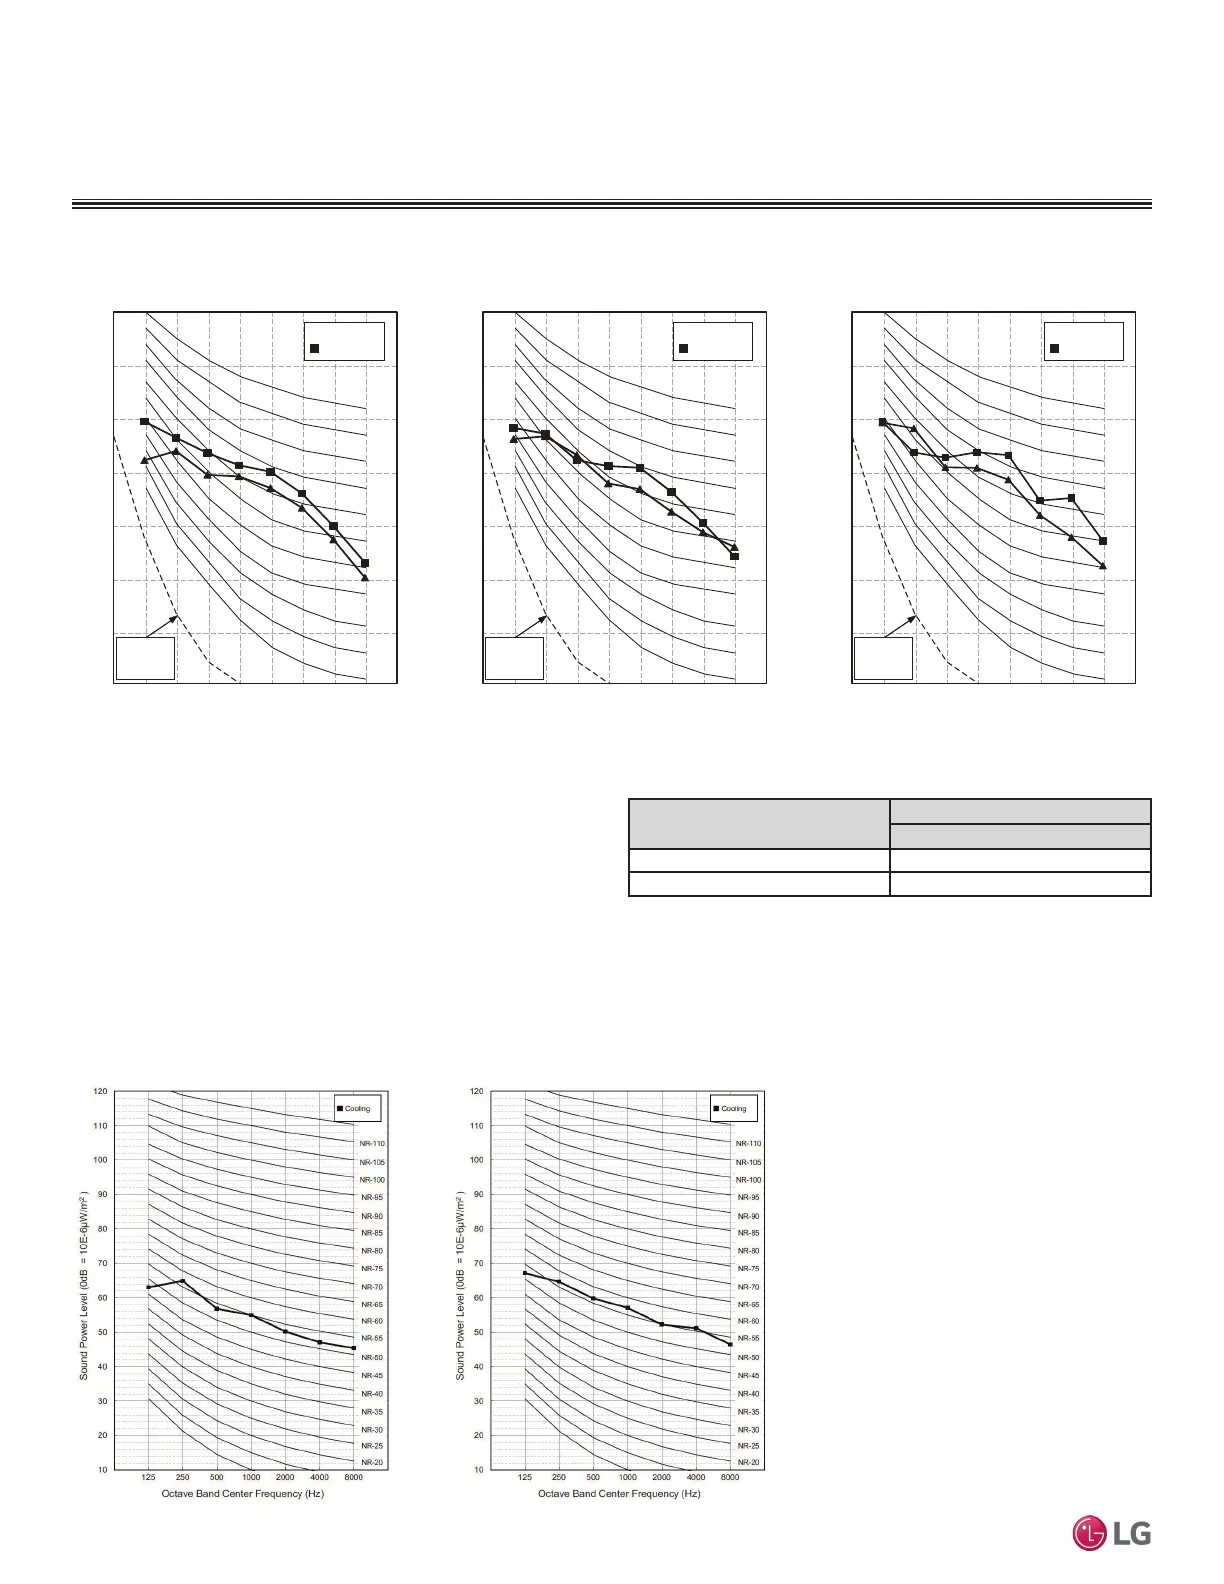
Octave Band Center Frequency (Hz)
Octave Band Sound Pressure Level (0dB = 20μPa)
10
20
30
40
50
60
70
80
63 125 250 500 1000 2000 4000 8000
NC-15
NC-20
NC-25
NC-30
NC-35
NC-40
NC-45
NC-50
NC-55
NC-60
NC-65
Approximate
Hearing
Threshold
Octave Band Center Frequency (Hz)
Octave Band Sound Pressure Level (0dB = 20μPa)
10
20
30
40
50
60
70
80
63 125 250 500 1000 2000 4000 8000
NC-15
NC-20
NC-25
NC-30
NC-35
NC-40
NC-45
NC-50
NC-55
NC-60
NC-65
Approximate
Hearing
Threshold
Octave Band Center Frequency (Hz)
Octave Band Sound Pressure Level (0dB = 20μPa)
10
20
30
40
50
60
70
80
63 125 250 500 1000 2000 4000 8000
NC-15
NC-20
NC-25
NC-30
NC-35
NC-40
NC-45
NC-50
NC-55
NC-60
NC-65
Approximate
Hearing
Threshold
LMU18CHV LMU24CHV LMU30CHV, LMU36CHV
▲ Cooling
Heating
▲ Cooling
Heating
▲ Cooling
Heating
$FRXVWLF'DWD
MULTI F OUTDOOR UNIT
Table 21: Sound Power Levels (dB[A]).
Model No.
Sound Power Level (dB[A])
Cooling
LMU180HV 64
LMU240HV 66
Sound Power Levels
• Data is valid under diffuse field conditions.
• Data is valid under nominal operating conditions.
• Sound power level is measured using rated conditions, and tested
in a reverberation room per ISO 3741 standards.
• Sound level will vary depending on a range of factors such as
construction (acoustic absorption coefficient) of particular area in
which the equipment is installed.
• 5HIHUHQFHDFRXVWLFLQWHQVLW\G% (ȝ:P
2
Figure 19: Sound Pressure Level Diagrams, continued.
Figure 20: Sound Power Level Diagrams.
/08+9
/08+9
 Loading...