M4 - Mx computer System | V2 | Servicing and Maintenance
•
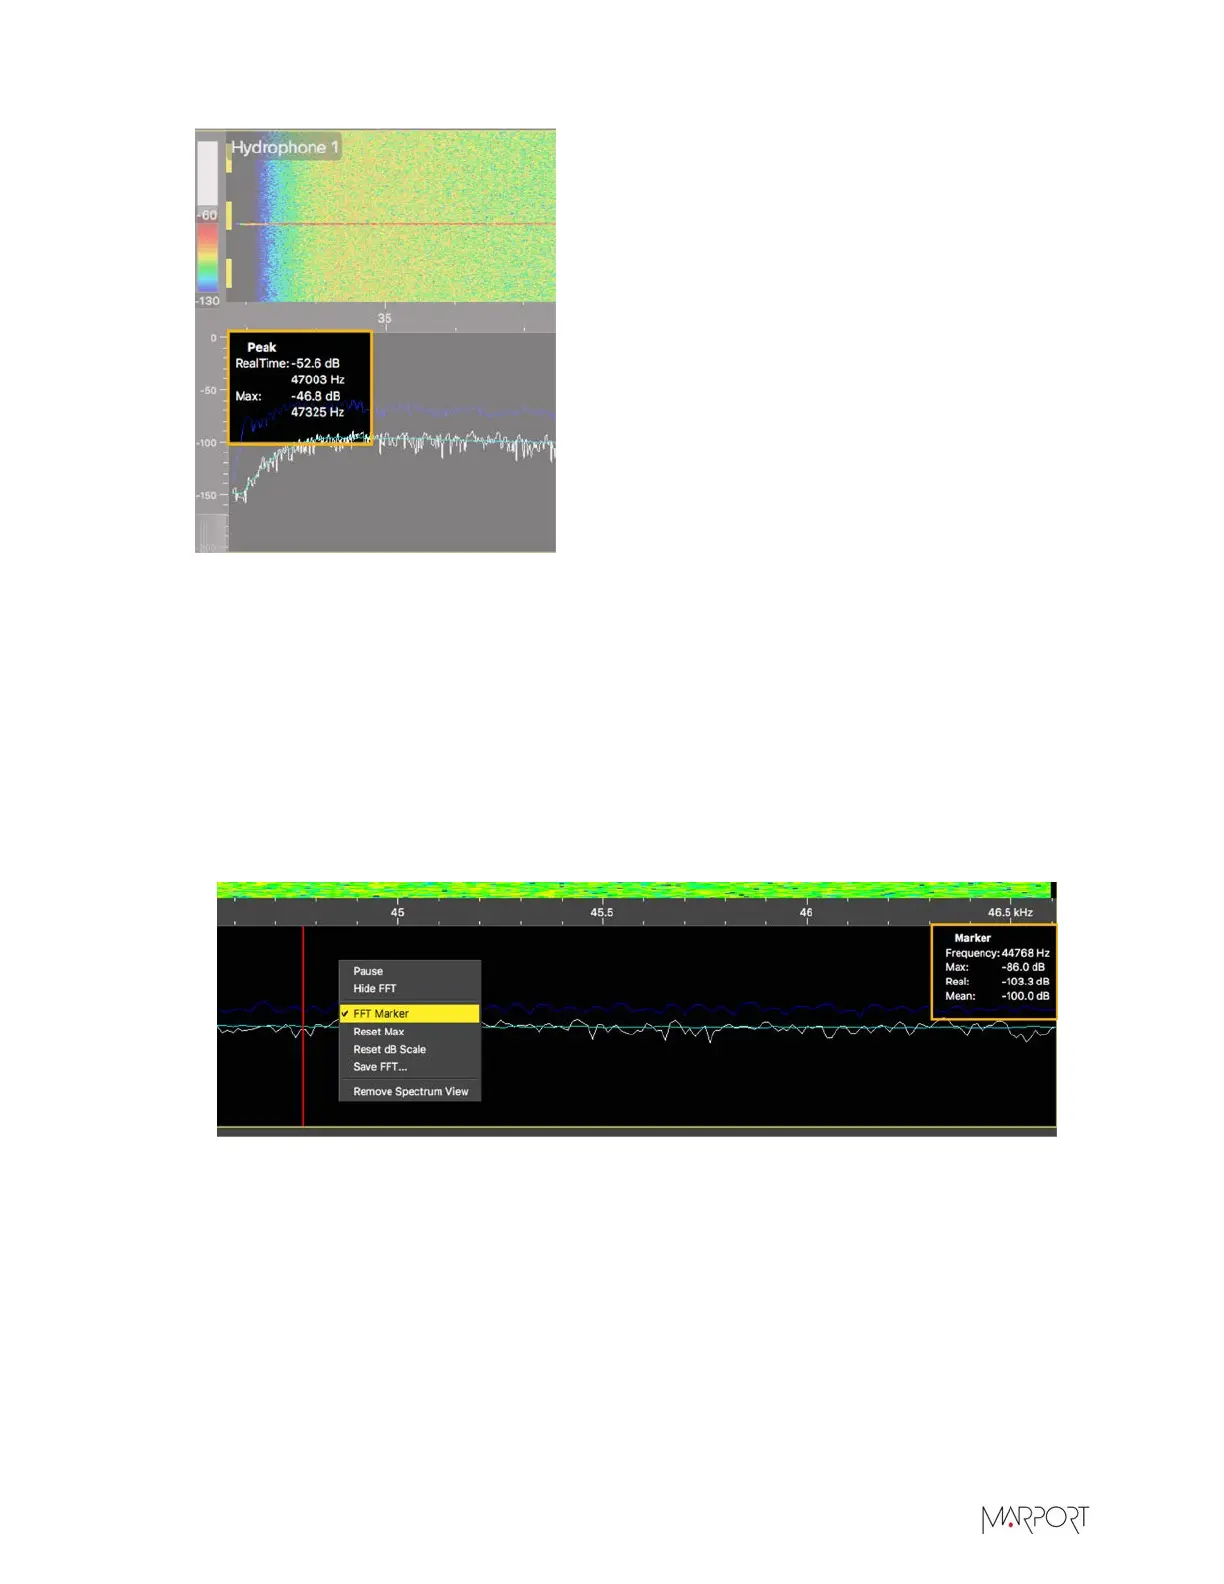
RealTime: the latest highest level of noise (dBV)
recorded and its frequency.
•
Max: the highest level of noise recorded since the
beginning of the spectrum and its frequency.
8.
Check that there is more than 12 dBV between the maximum noise level (dark blue line) and the
average noise level (cyan line) on the peak of sensor frequencies.
9.
If you changed the configuration of the hydrophone or sensors, right-click the graph and click
Reset Max to reset the dark blue line showing the maximum level of noise.
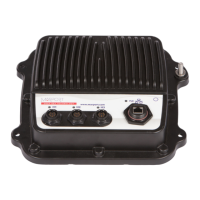
10.
To check the maximum, mean and real time measures of noise level at specific frequencies:
a)
Right-click the FFT plot and click FFT Marker.
b)
Click and drag the marker at a specific point.
Frequency and levels of noise at the marker position are displayed on the right side of the
graph.
11.
Right-click the spectrum and click Pause if needed.
12.
To save data recorded by the spectrum in a *.txt file, right-click the FFT plot and click Save
FFT.
The FFT file lists for the entire bandwidth used by the hydrophone (frequencies are in Hz) the
maximum and mean levels of noise since the FFT export has started and the last real time level
of noise before the export (dBV).
| 27