VP-ITC MicroCalorimeter User’s Manual
Buttons for VP-ITC Data Display
This group of buttons allows you to rescale the y-axis by simply
clicking on a single button. Alternatively, you may graph all the data
by selecting Plot:Rescale to Show All from the Main Display menu
or you may rescale either the x or y axis by double-clicking on the
axis and manually entering the new scale in the opened Axis dialog
box (see the Origin User’s Manual for more information)
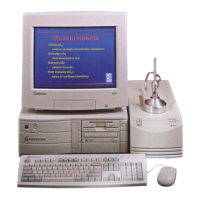
Display Mode
Rescale To Show All – Clicking this button, rescales the x and y axis
ranges so that all data will be displayed on the graph.
DP Scale Controls
Auto-View 1 – When you click on this button, the y-axis will be
rescaled so that the last data DP data point plotted will be
centered on a full scale determined by the entry in the Full
Scale-Auto View 1 text box (see Edit Range description below). Please note: For the
Auto-View 1 (& 2) buttons to work properly, there must be data plotted in the Main
Display graph.
Auto-View 2 –This button provides a second range for rescaling the y-axis centered on the last
DP data point plotted (determined by the entry in the Full Scale-Auto View 2 text box
(see Edit ranges below)).
Saved View 1 - When you click on this button the y-axis will be scaled from the value entered in
the Saved View 1-Y Min. text box to the value in the Saved View 1-Y Max. text box.
(see Edit Range description below).
Saved View 2 – When you click on this button the y-axis will be scaled from the value entered in
the Saved View 2-Y Min. text box to the value in the Saved View 2-Y Max. text box.
(see Edit Range description below).
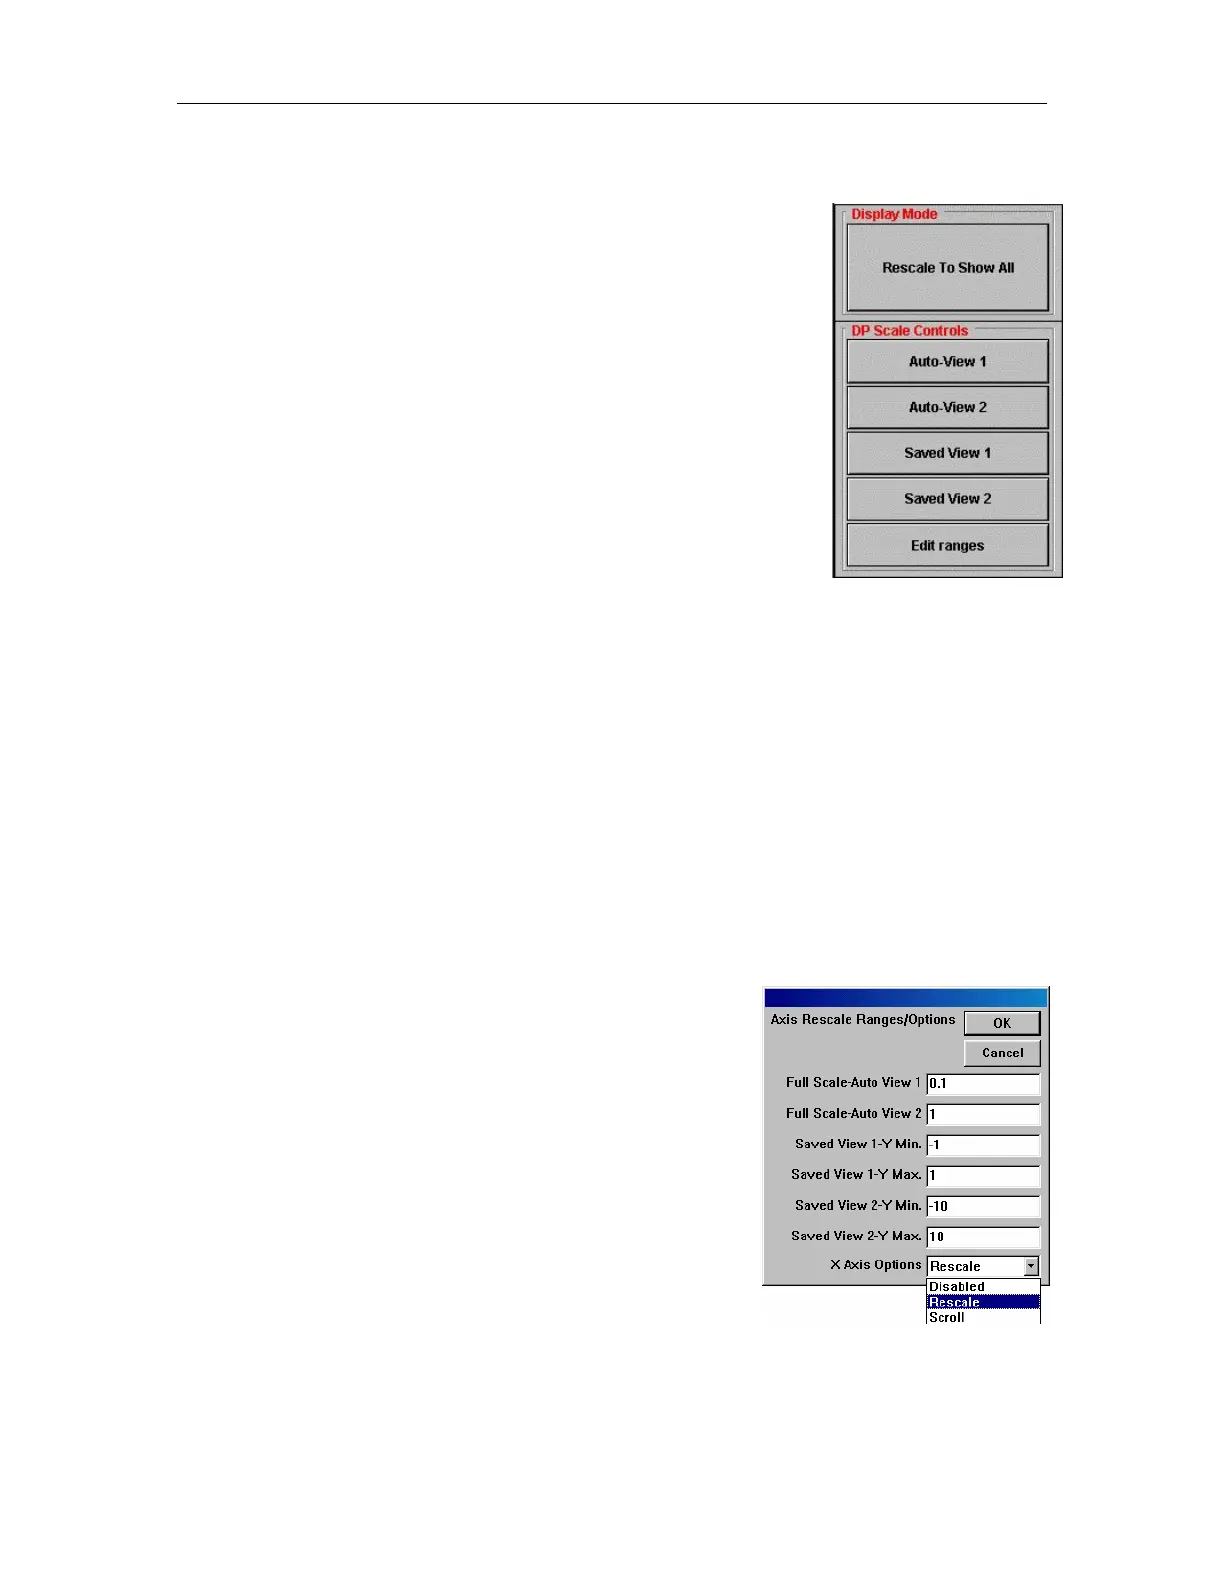
Edit Ranges: Opens a window that contains parameters to be
used with the aforementioned buttons. In addition to
the Auto-View and Saved-View entries, which are
described above, there is a drop down list box which
will control the automatic re-scaling of the x axis.
The drop down list is labeled as X Axis Options and
contains three choices, as defined below
X Axis Options – Determines the action taken by VPViewer
when the current time data extends beyond the X Axis display
range.
Disabled: Takes no action. Current data may be plotted
off screen.
Rescale: Extends the maximum X Axis setting by 25%,
resulting in a larger display range.
Scroll: Extends the minimum and maximum X Axis setting by 25%, preserving the same
range of the display, but always displaying the most recently plotted data.
32