4.7.
Hypertension risk indicator
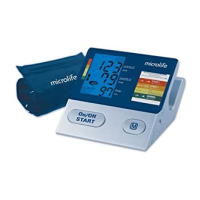
The bars on the left-hand edge of the display show the possible range for
a blood pressure reading. The reading can fall within the normal (green),
borderline (yellow) or danger (orange, dark orange) range.
The classification is based on standards established by the 2017 AHA and ACC.
Refer to the chart in section 7.2 of this instruction manual for details of the
classifications.
A triangle is displayed to the right of the traffic light bar according to your
measurement.
•
If your triangle is in the green zone, your measurement is "Normal,"
according to AHA/ACC 2017 standards.
•
If your triangle is in the lower yellow zone, your measurement is "Elevated."
•
If your triangle is in the upper yellow zone, your measurement is "Pre-
Hypertensive."
•
If your triangle is in the orange zone, it is "Stage 1 Hypertensive."
•
If your triangle is in the dark orange zone, it is "Stage 2 Hypertensive."
"Normal" Blood "Elevated" Blood "Stage 1 Hypertension" "Stage 2 Hypertension" "Hypertensive Crisis"
Pressure Reading Pressure Reading Blood Pressure Reading Blood Pressure Reading Blood Pressure Reading

 Loading...