3-106
Features and controls
3
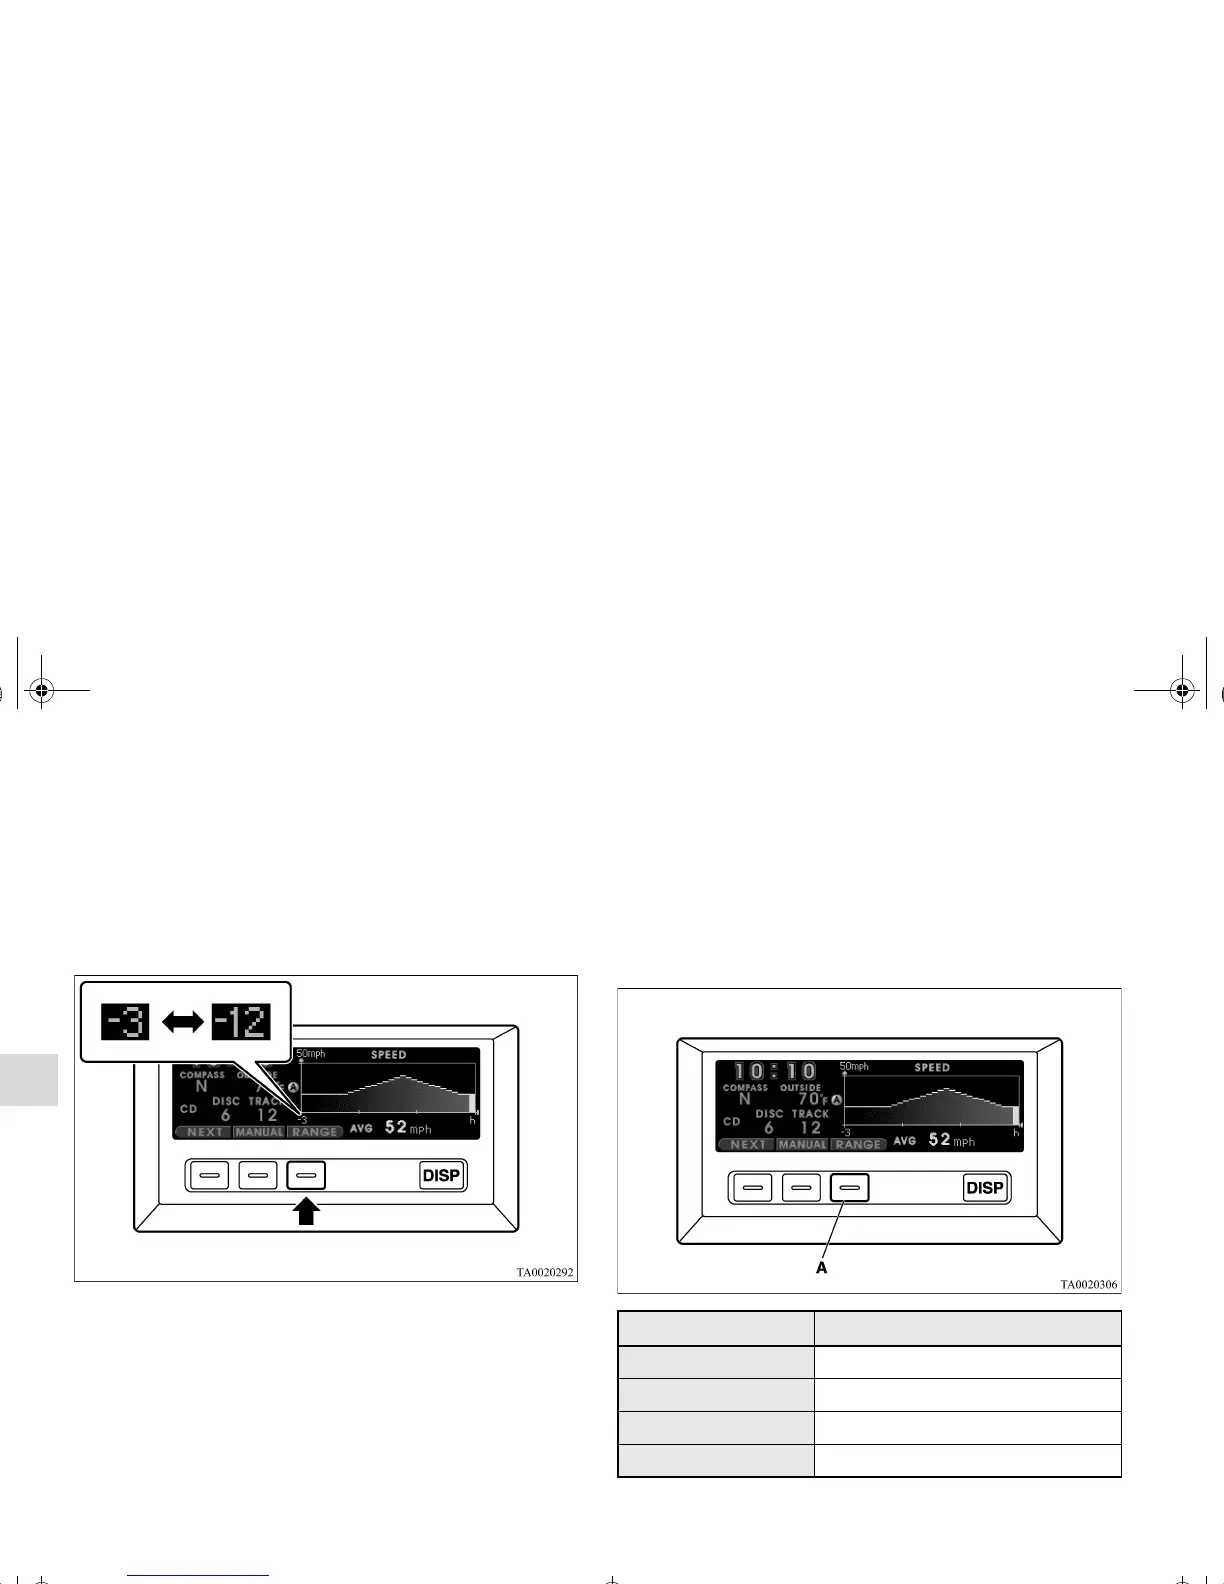
Graph indication
N00501800039
The average speed, average fuel economy, elevation, and out-
side temperature are each shown as a graph at the same time as
being shown numerically.
The range for which historical data are shown in the graphs
changes each time the “RANGE” function button is pressed
lightly.
● -3 hours: The average value is added to the graph every 6
minutes. Data for a maximum of three hours are shown in
the graph.
● -12 hours: The average value is added to the graph every
24 minutes. Data for a maximum of twelve hours are
shown in the graph.
OTE
● When the range for which historical data are shown is
changed for one graph, it also changes for the other
graphs.
Display unit selection
N00501900027
When you want to select the other unit, pressing the function
button (A) for more than 3 seconds changes the unit as follows.
Mode Unit
Driving range miles
→
km
→
miles
Average speed mph
→
km/h
→
mph
Average fuel economy mpg
→
L/100km
→
mpg
Elevation feet (ft)
→
m
→
feet (ft)
BK0121600US.book 106 ページ 2010年4月12日 月曜日 午前10時39分

 Loading...