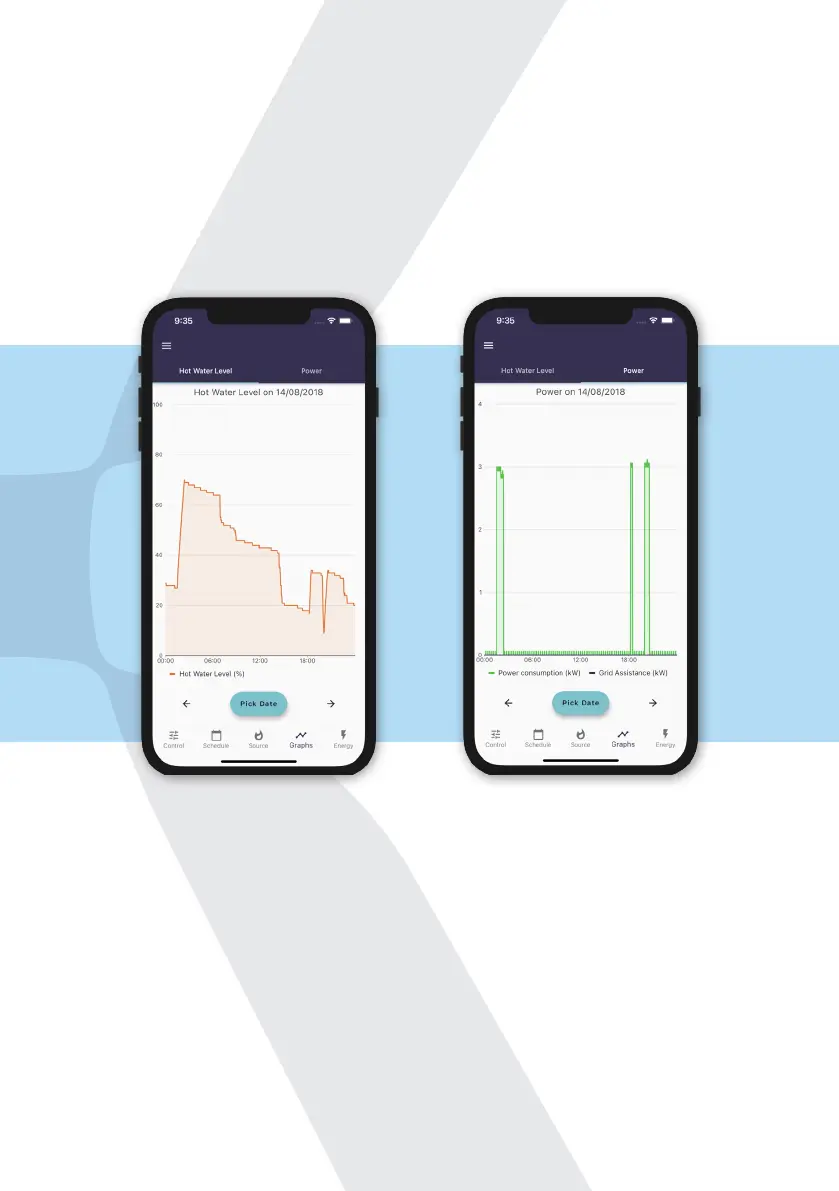
Viewing hot water usage
Click the Measurements tab to view graphs visualising your hot water usage
and electricity consumption. You can see graphs of previous days by clicking
Pick Date underneath the graph.
You can see how these graphs are consistent with the set heating schedule and
reect water usage and natural cooling of the water throughout the day.
For example, in the hot water level graph you can see the hot water level rising
to 70% at 01:30, as per the schedule. Just after 18:00, the water level dropped
below 18%. As the tank’s schedule was set to maintain between 18% and 35%,
the tank automatically boosted itself to 35%. This worked out well for the user
as shortly afterwards there was a large draw event, and without this boost
there wouldn’t have been enough hot water available.
Swipe right to see the Power graph. This shows how much power was used by
the immersion heater (if heating by electric). In this example, there are three
spikes, one at 01:30, and another one after 18:00 and 20:00. This is what you’d
expected to see from looking at the heating schedule and hot water levels.
16