24 Chapter 3. Operation
Ideally the spectrum analyser would be used with an independent
frequency discriminator that is insensitive to laser power fluctua-
tions [11]. Good results can be achieved by monitoring the in-loop
error signal but an out-of-loop measurement is preferable, such as
measuring the cavity transmission in a PDH application. To ana-
lyse the error signal, connect the spectrum analyser to one of the
MONITOR outputs set to “FAST ERR”.
High-bandwidth locking typically involves first achieving a stable
lock using only the fast servo, and then using the slow servo to
improve the long-term lock stability. The slow servo is required
to compensate for thermal drift and acoustic perturbations, which
would result in a mode-hop if compensated with current alone. In
contrast, simple locking techniques such as saturated absorption
spectroscopy are typically achieved using the slow servo, with the
fast servo compensating higher-frequency fluctuations only. It may
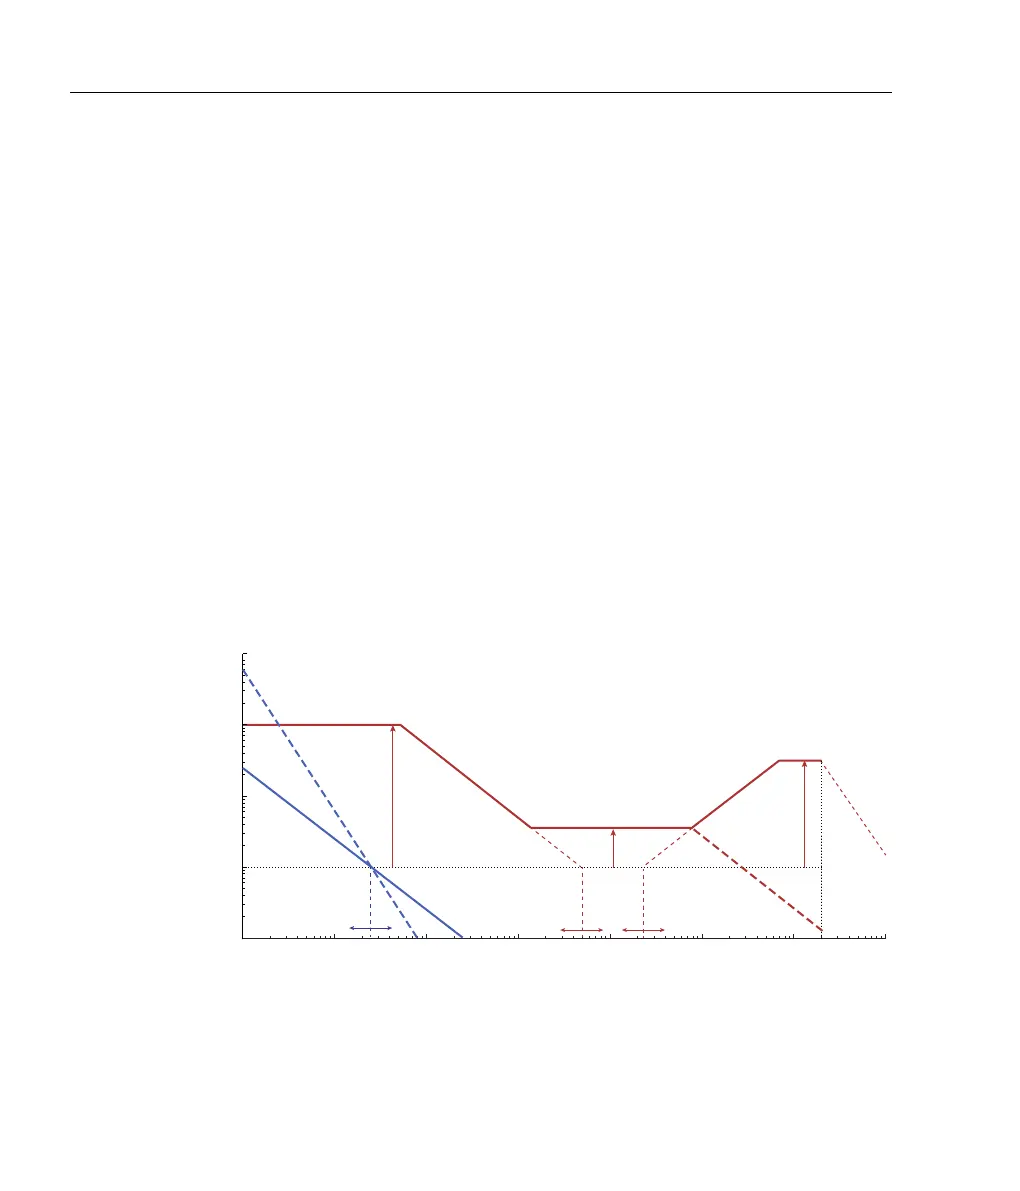
be beneficial to consult the Bode plot (figure 3.3) when interpreting
the error signal spectrum.
Gain (dB)
20
0
40
60
–20
10
2
10
1
10
3
10
4
10
5
10
6
10
7
Fourier frequency [Hz]
Integrator
Double integrator
Proportional
High freq. cuto
Dierentiator
Integrator
10
8
FAST LF GAIN (limit)
FAST
GAIN
DIFF GAIN (limit)
FAST INT
FAST DIFF
SLOW INT
Filter
Figure 3.3: Conceptual Bode plot showing action of the fast (red) and slow
(blue) controllers. The corner frequencies and gain limits are adjusted with
the front-panel knobs as labelled.
 Loading...