15
MORDAX : DATA
User Guide
SYS V. 01.00.00
BOOT V. 01.00.00
Updated: 161229
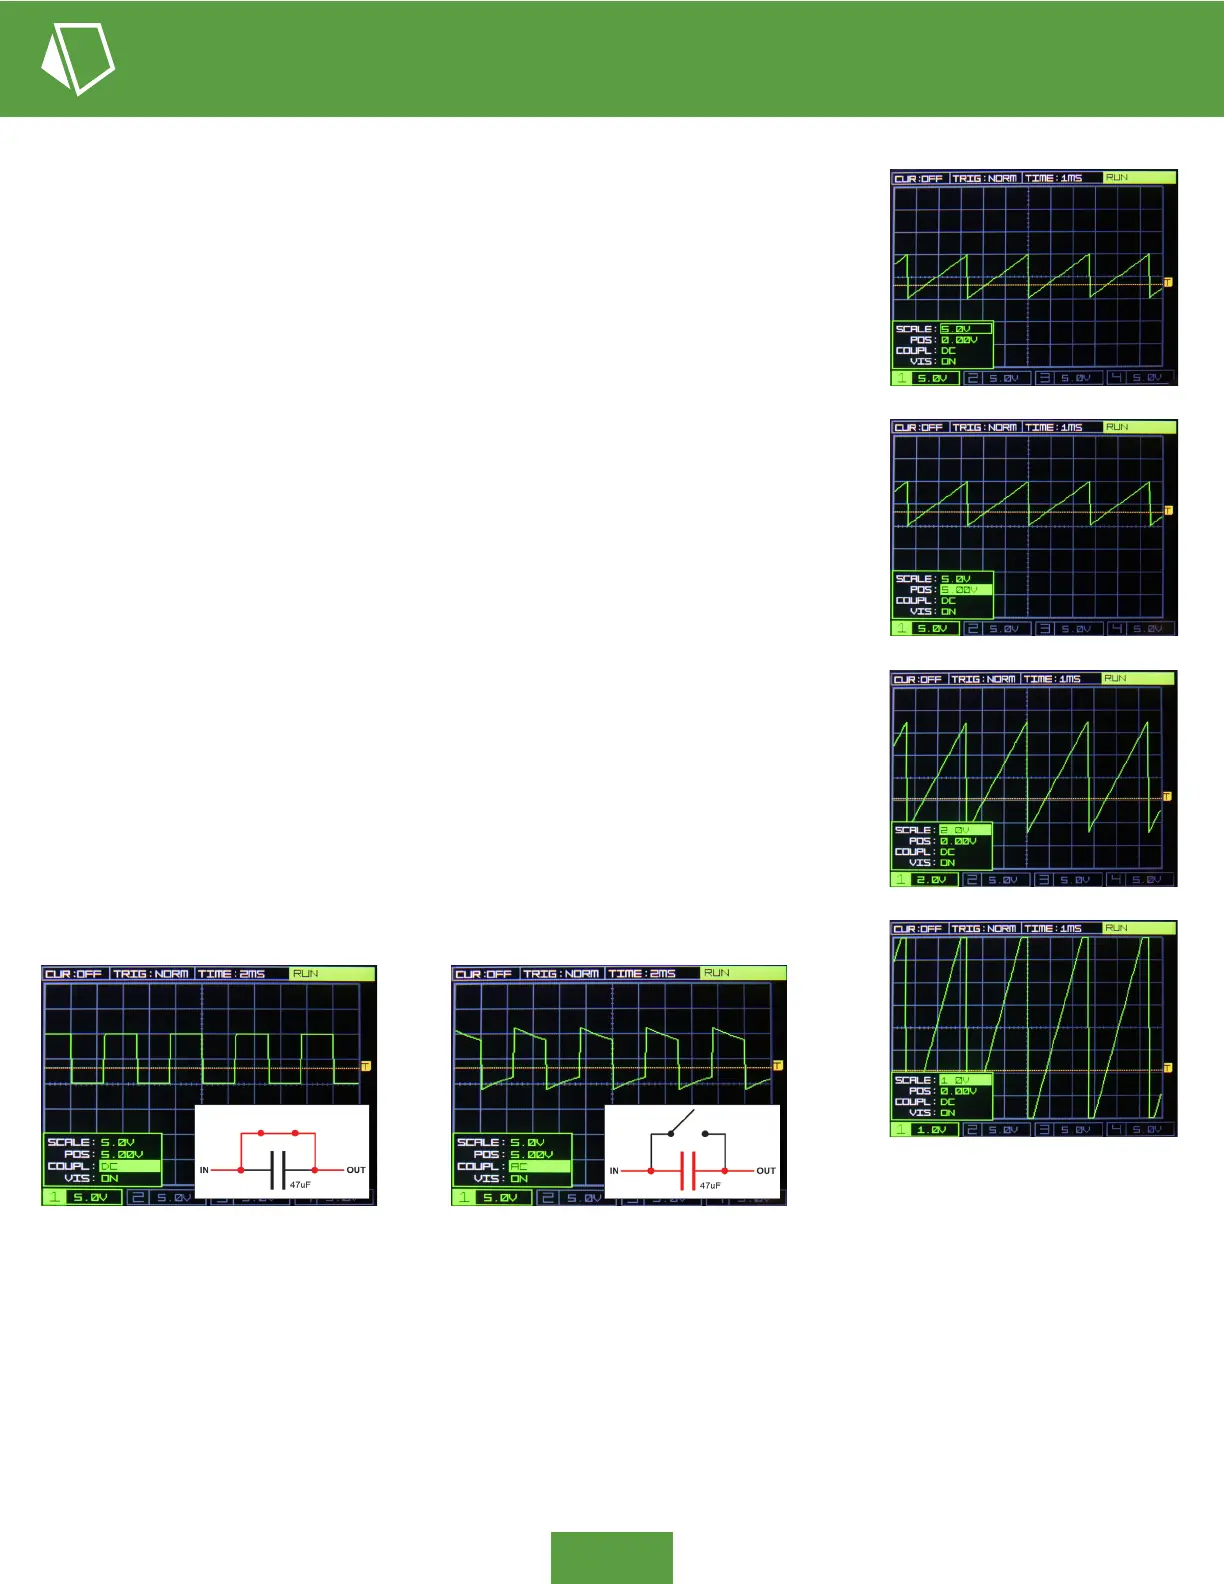
Voltage - Vertical Scale (Y-axis)
Also available in the channel pop-up menus is the parameter COUPL, which selects AC (alternating current) or DC (direct current)
coupling on the channel’s input. AC coupling places a 0.47uF capacitor in series with the channel input, which blocks DC signals,
only allowing AC signals to pass. For example, if you have AC coupling selected and you put a constant 5V CV signal into the
input, it will show 0V on the scope, as that 5V DC has been blocked. Similarly, the at components of a sqaure wave will appear
distored when AC coupling is selected, as these are periods of DC (see images above). This distortion becomes more pronounced
the lower the sqaurewave frequency becomes (longer periods of DC). Typically, you will want to view signals as COUPL: DC.
Fun fact: The squarewaves you hear coming out of a speaker are generally distorted as shown in the AC coupled image, as the
signal lines to speakers most always have these series DC blocking caps.
1
3
2
4
Coupling - AC / DC
Each channel’s SCALE parameter shows the volts-per-division of the vertical scale. On
the grid there are 8 divisions on the Y-axis (the grid is 8 boxes tall). The vertical scale’s
resolution can be controlled independently for each channel, accessed via the channel’s
pop-up menu at the bottom of the display.
For example, in image 1 right, the SCALE parameter for channel 1 is set to 5.0V per
division. That means each square on the grid is now 5.0V tall, and with 8 vertical divisions
on the grid, the entire display is showing a range of 40V. You can see that the incoming
saw wave is 2 boxes high, so 2 X 5.0V gives 10V; at a glance you now know the waveform
spans 10V peak-to-peak.
Also in the rst image, note that the position of channel 1 (parameter POS) is set to 0.00V;
this means the center of the grid is displaying 0.00V. The saw wave spans one box above
the center grid line, and it spans one box below; we now know the saw wave’s actual
voltage amplitude, +5V to -5V peak-to-peak
If we set the position to 5.00V (image 2) the saw wave is moved up, offset by vertical
division (one box) at this scale.
Changing the SCALE parameter has the effect of zooming in or out on the signal. Images 3
and 4 show the same +/-5V saw wave, but the vertical scale is changed, making the signal
larger on the display. Recall that at SCALE:5.0V the display can show a full 40V (8 vertical
divisions, 8 x 5 = 40). Similarly, at a scale setting of 2.0V the screen can display 16V from
top to bottom, and at a scale of 1.0V it displays a range of 8V.
In image 4 you can see that our 10V peak-to-peak saw wave is clipped at it’s top and
bottom, because it spans a voltage range wider than what can be shown at SCALE:1.0V
(8V full display range).
 Loading...