17
OVERVIEW
as the maximum peak and RMS values that occurred
during the measurement. With a resolution bandwidth
extending up to 32 MHz, the SRM-3006 is also fully
equipped to handle the latest generation of mobile
communications systems.
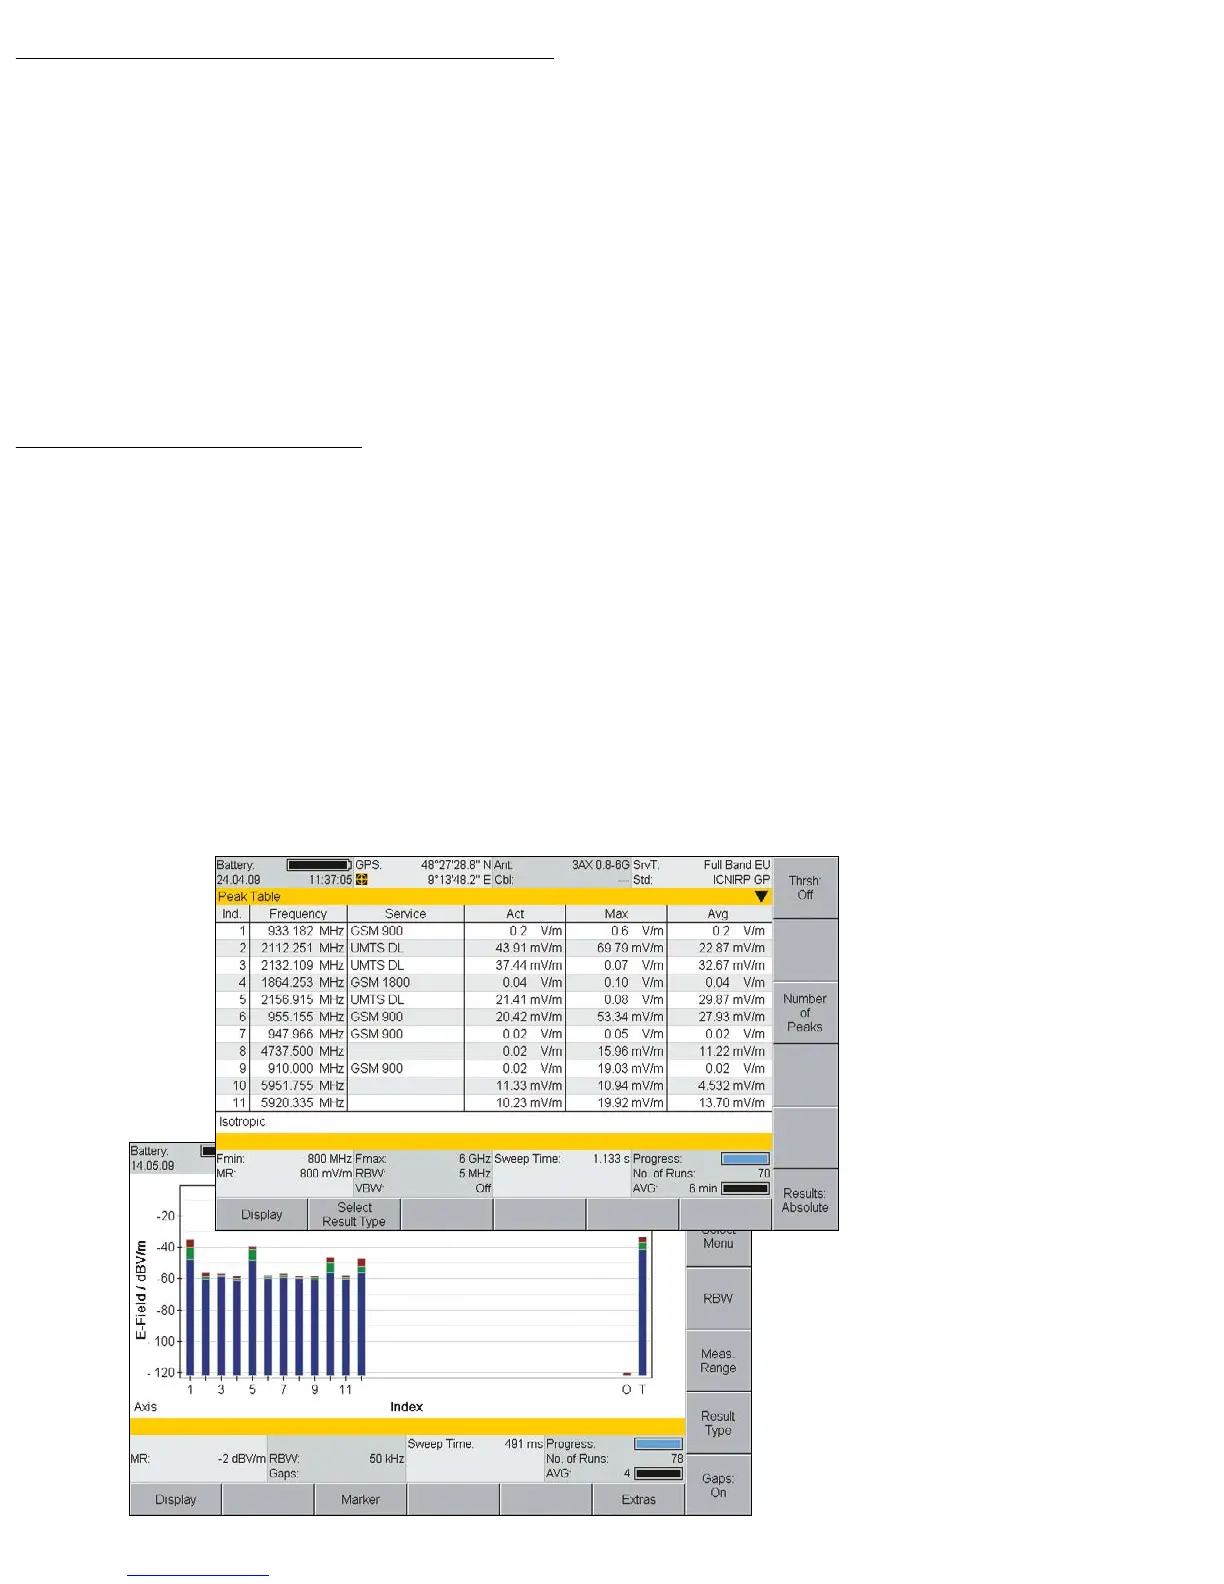
Expert users don’t need to put up with inconvenience,
either. The SRM automatically generates a list, even
from the most detailed spectrum. This ‘Peak Table’ gives
access to important details.
Keep it simple: Evaluation of a
‘Spectrum Analysis’ using the ‘Peak
Table’. The list of the highest field
strengths and their corresponding
frequencies, service names and even
the names of the service providers if
these have been recorded in service
tables is particularly convenient. Items
in the table can be sorted according
to various criteria.
‘Safety Evaluation’ in the UMTS range:
The individual channels with their
channel numbers are shown next to each
other in the bar graph display, just like
a textbook. The “T” bar on the extreme
right shows the total power density. The
“O” bar shows the contributions from
the frequency gaps (others) between the
services.