Apex Classic Setup and Programming Guide v2.2 Page 70
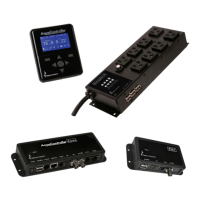
The Dashboard is
comprised of a palette and tiles. Your palette is like a blank canvas. Tiles
contain the status of outlets, probes and embedded URL’s. You can have up to 4
Dashboards on a controller. You access and configure them via your web pages
on the Dashboard menu.
Initially, every outlet and probe will have a tile on the pallet. You then can
configure your individual Dashboards by simply dragging tiles around. There’s a
virtual drawer called ‘Unused Tiles’ that contains any tile you
don’t want displayed. You can’t delete tiles but you can store
them in this “drawer” of Unused Tiles. Later if you want one of
those tiles, simply drag it back to your palette.
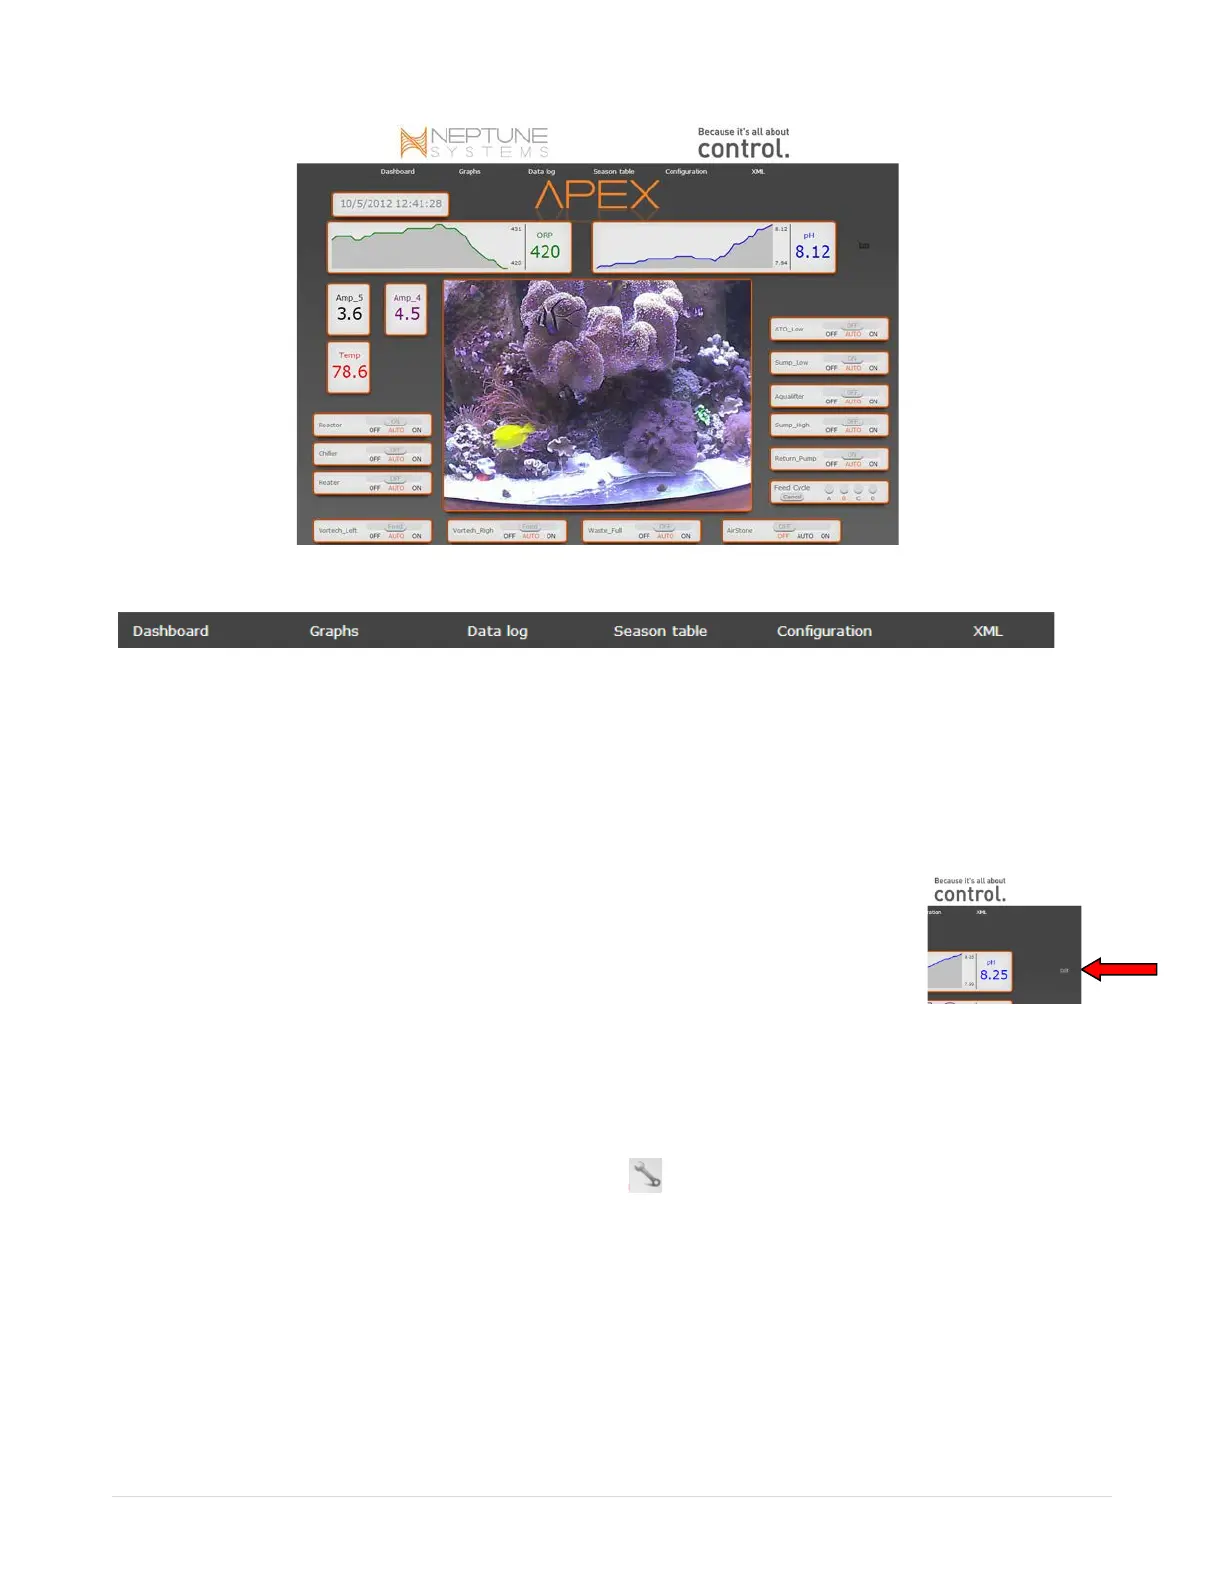
To begin configuring your Dashboard, click ‘edit’ on the far right of the pallet.
When you do, the Unused Tiles tile will appear along with an option to save.
Simply drag tiles around until you are satisfied with the look. Then save.
Note that with your probe tiles there will be a small wrench in the right
corner. This gives you additional options. If you click the wrench it will toggle
between expanded and compressed mode. In expanded mode you get the
current probe reading and a graph of recent probe data. In the compressed
mode you simply get the current probe reading. Probe tiles can consume a fair
amount of space and this gives you flexibility in what you want to see.
 Loading...