71
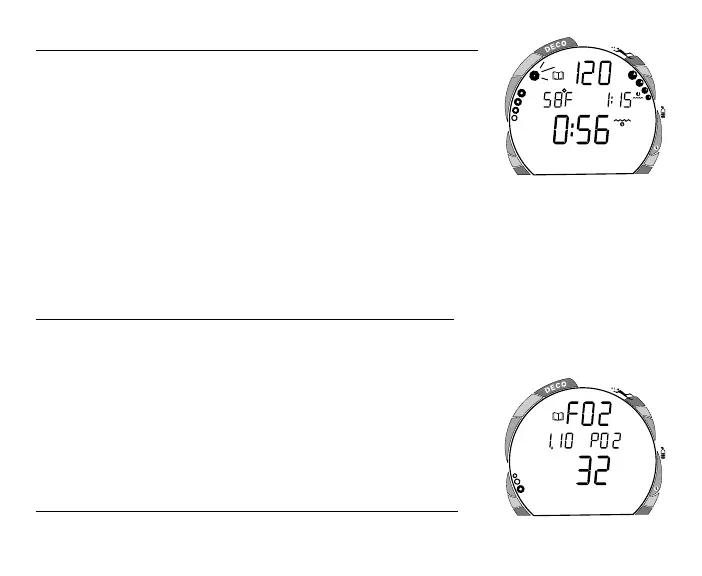
To view the Second Screen of the Log (Nitrogen data) -
Press the Side (Select) button 1 time (while viewing the Time/
Date). Displayed will be (Fig. 87) -
• Log Mode icon
• Maximum Depth - reached during the dive (and icon)
• Temperature - minimum during the dive (and icon)
• Surface Interval - prior to that dive (and icon)
• Elapsed Dive Time (and icon)
• Variable Ascent Rate Indicator - showing the maximum ascent
rate maintained for 4 consecutive seconds during the dive
• Tissue Loading Bar Graph - showing tissue nitrogen loading at the time you surfaced at
the end of the dive. Also, the segment that reflects the maximum loading during the dive
will appear flashing.
To view the Third Screen of the Log (Oxygen data)
Press the Side (Select) button 1 time (while viewing the Nitrogen data). Displayed will be
(Fig. 88) -
• Log Mode icon and graphic FO2
• Maximum PO2 level reached during that dive and PO2
graphic
• FO2 set point for that dive (%O2) and O2 icon
• O2 Bar Graph - showing oxygen accumulation at the end of
the dive
To access the first screen of the previous dive's Log
• Press the Front (Advance) button 1 time.
Fig. 87 - Log (Nitrogen Data)
Fig. 88 - Log (Oxygen Data)
FEET
ATR
MAX
O
2
ATR
O
2
O
2
M
A
X