34
12. SPECIFICATIONS AND DIMENSIONS
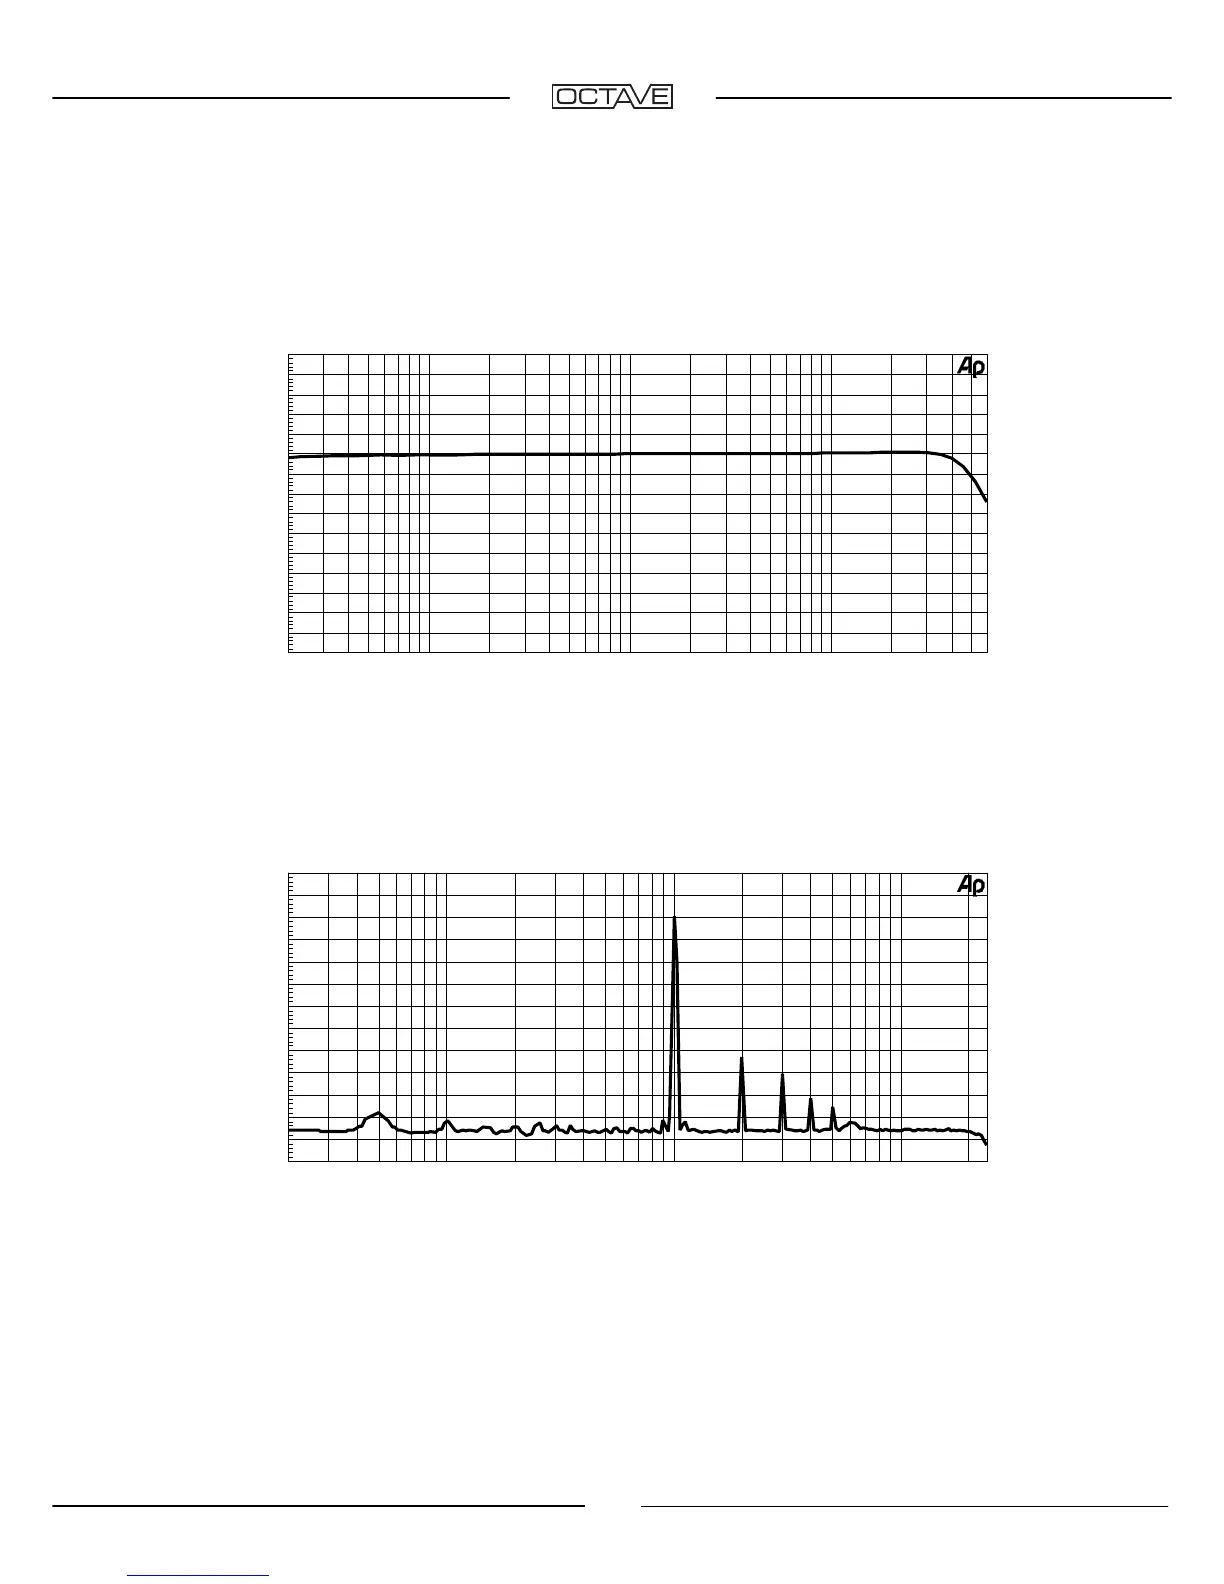
Graph 2: Frequency response, 5 W into 4 ohms
Audio Precision Frequency Response V 70 SE 5 V / 4 Ohm
-10
+5
-9
-8
-7
-6
-5
-4
-3
-2
-1
-0
+1
+2
+3
+4
d
B
r
A
20 60k50 100 200 500 1k 2k 5k 10k 20k
Hz
The frequency response curve clearly shows the low frequency extension of the
V 70 SE linear to 10 Hz The loss at 20 Hz is less than 0,2 dB
Graph 3: Noise spectrum
Audio Precision
A-A FFT
-120
+10
-110
-100
-90
-80
-70
-60
-50
-40
-30
-20
-10
+0
d
B
r
A
20 20k50 100 200 500 1k 2k 5k 10k
Hz
Noise spectrum at 1 kHz / 5 W into 4 ohm – there is no mains interference to be seen.
(50 Hz < 200 µV, 100 Hz < 70 µV) The k2, k3, k4 and k5 noise spectrum is extremely
low and falls quickly.
 Loading...