6
Advanced Partial Discharge Measuring System MPD 600
2 The MPD 600 Software
Once the computer has started, double-click the mtronix Icon to start the software:
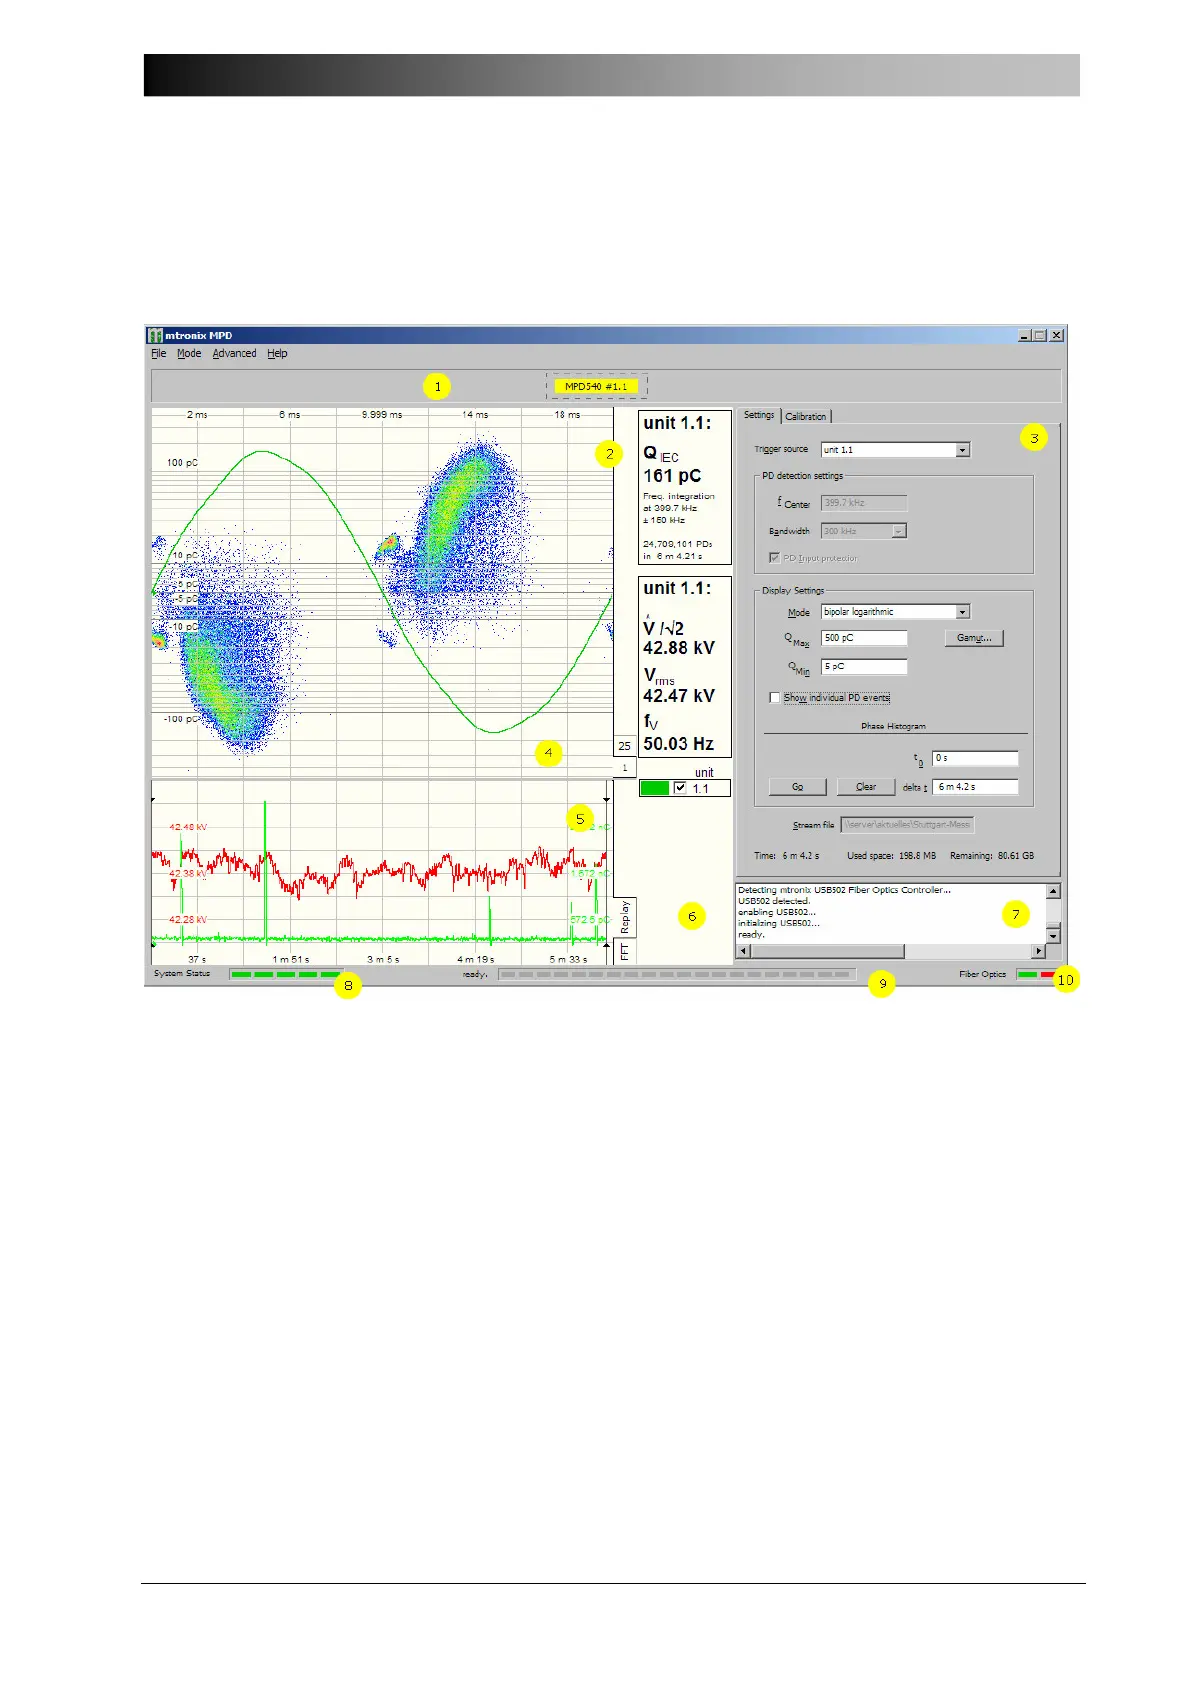
Figure 5: mtronix Basic Software
The different sections of the MPD 600 window:
1 – Acquisition unit display. The acquisition unit display shows which units have been
detected by the software. Each detected unit is represented by a colored rectangle (e.g.
MPD600#1.1). A unit can be selected in the acquisition unit display by clicking on the
corresponding colored rectangle; the selected unit then shows a dashed selection frame
around its box. Selecting a unit prompts the software to show the rest of the workspace,
which is not visible if no unit is selected. To hide the visualization and control panel views,
click anywhere on the empty space next to the units. This will suspend any measurements
currently in progress. To resume, re-select a unit. Hovering with the mouse over a selected
unit rectangle will pop up a unit information window, which shows the unit’s status, supply
voltage, and any pending warning messages.
2 – Visualization display. The visualization display is only visible if a unit is selected in the
acquisition unit display. It takes up most of the left side of the workspace. The visualization
display is further subdivided in the large scope view , the small scope view , and the
measured quantities display .