15
1. Open the ‘Analyse’ tab.
2. Select ‘Open Video’ and use the le dialogue to select a video for analysis.
3. The image will appear in the centre of the screen.
4. Select a drop density. If the liquid is not in the drop-down list, select ‘Add New’ to add a new liquid to the
settings.
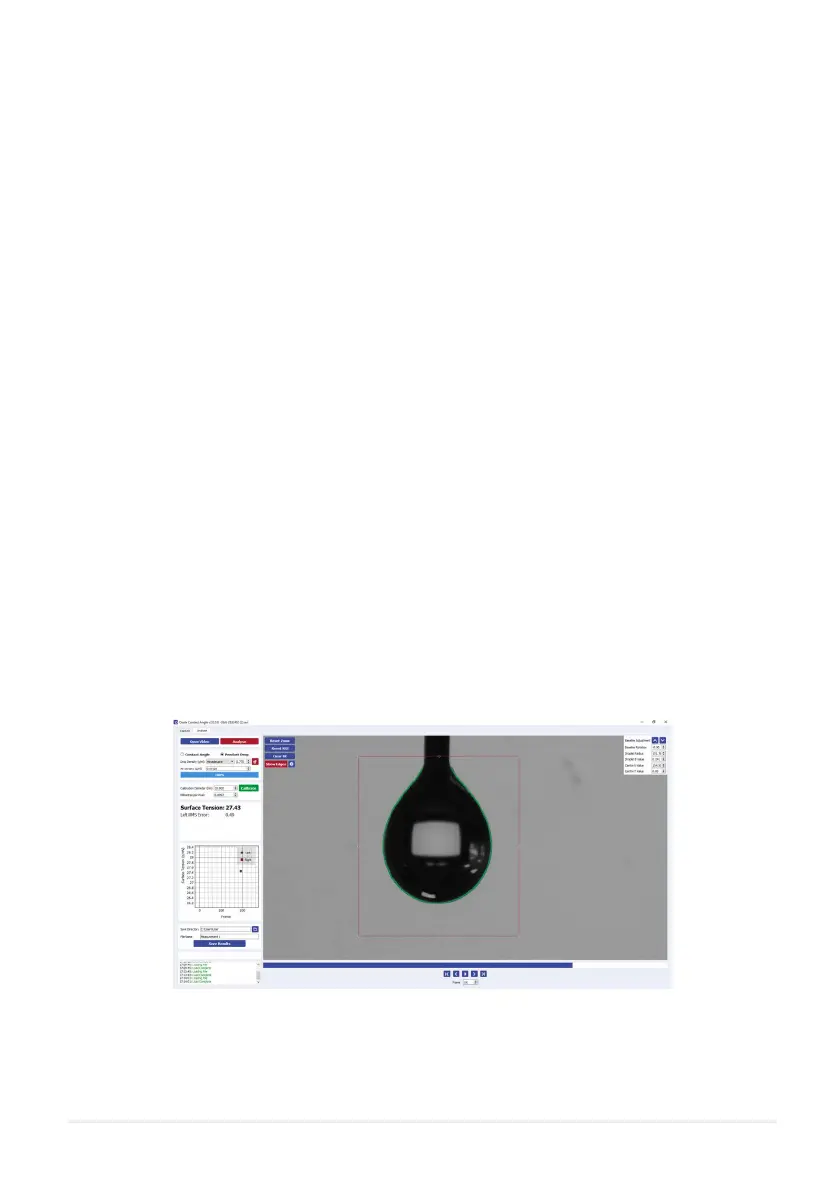
5. Use the video controls at the bottom of the image to navigate to a frame that has a droplet.
I. The droplet should be pushed out of the needle tip until it is close to falling.
6. Adjust the region of interest (ROI) box until the entire droplet and the tip of the needle is within the box
(as shown in Figure 8.6).
I. If the image is slanted, you can adjust the image angle using the ‘Baseline Rotation’ box in the top
right corner.
7. Click ‘Analyse’.
I. The software will detect the edges of the droplet within the ROI.
II. A tting technique is applied to the droplet. The parameters of the t (radius, B number, X0, Y0)
are shown in the controls to the top right of the viewing window.
III. The calculated surface tension is displayed in the left corner of the screen.
8. If the droplet t looks poor, the t parameters can be adjusted manually to achieve a better t.
9. Choose a directory and save the results.
I. The results are saved in a .csv le, which can easily be opened in any data analysis program.
8.3.2 Surface Tension Measurements
Note: Before a surface tension measurement can be performed, the system should rst be calibrated. For
calibration instructions, please see section 9.
Figure 8.6. Surface tension droplet tting.