23
Figure 10.1. Region of interest box.
10.1.1 ROI Box Bottom Line (Baseline)
10.1.2 ROI Box Top, Left and Right Lines
The most important line is the bottom, as this denes the baseline of the measurement. A useful method for
determining baseline position is to use the point of reection of a droplet on a surface. Figure 10.1 shows a
droplet reecting on its substrate. The pointed edges of this droplet are used to position the baseline. Only
the part of the image above the baseline will be used in the tting and resultant contact angle calculations.
The top, left and right sides of the ROI box are used to exclude any unwanted features from the image. If
there is a second droplet in the same image, this should be excluded from the region of interest.
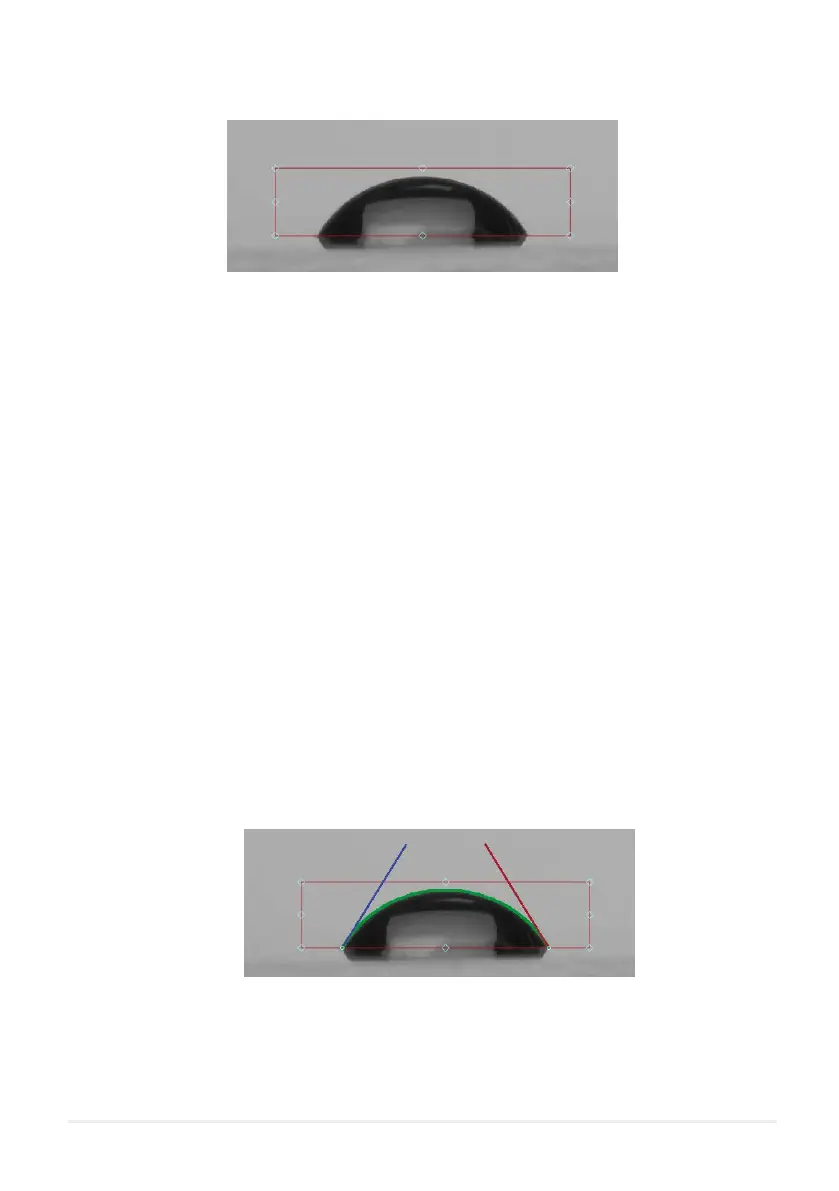
10.2 Polynomial Fitting
If the contact angle is above 10° then the software will t a polynomial to the edge of the droplet. The
polynomial t is overlaid on the image as a green line. The detected edge is displayed as green dots, which
are more visible when zoomed in to the image. The blue and red straight lines show the left and right contact
angles respectively.
Figure 10.2. Polynomial tting to a droplet edge.