27
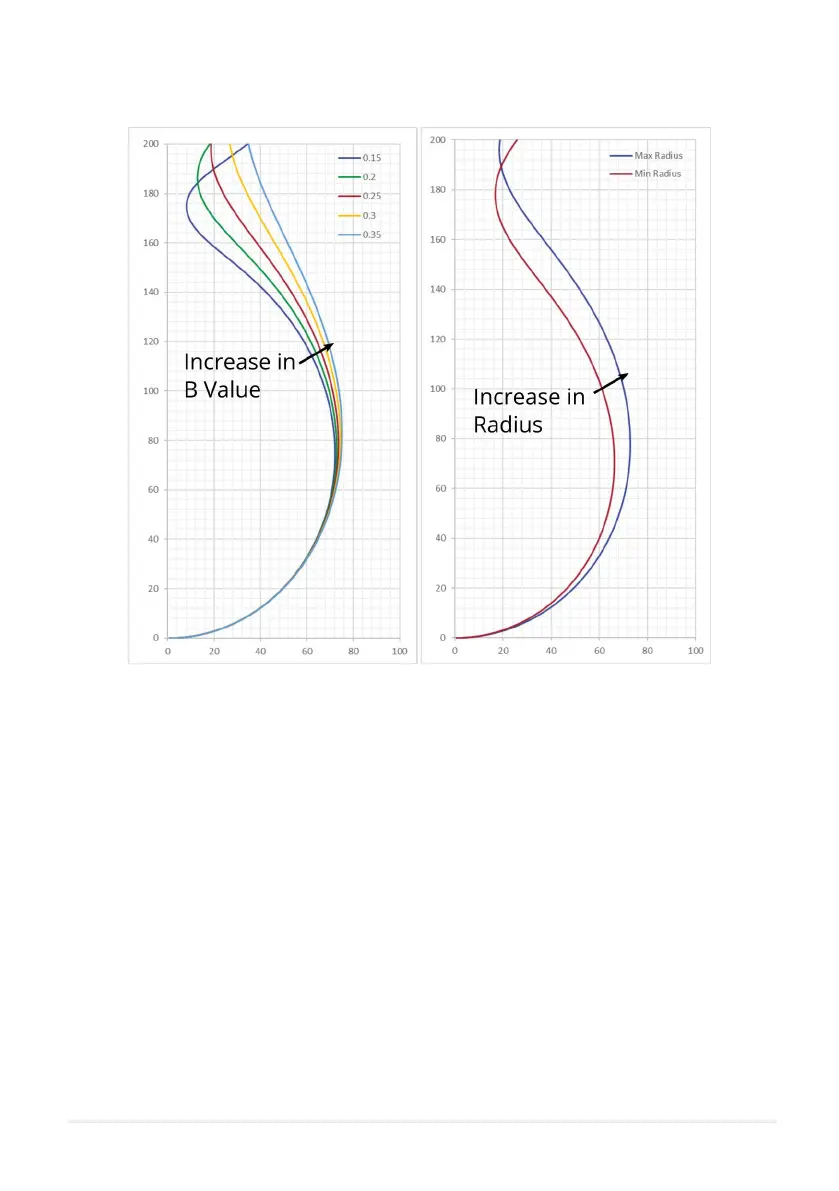
Figure 10.9. Plots demonstrating how a change in tting constant or radius aects the simulated droplet shape.
The software iterates through value of radius and B to create many dierent simulated droplets. It then
compares the simulated droplets with the detected edge of the droplet in the region of interest. The
simulated t that most closely matches the detected edge is chosen as the ‘real’ droplet. The dierence
between the simulated edge and the detected edge is the root mean squared error (RMSE). This is displayed
when a measurement is performed and can be used as an indicator of how closely the simulated droplet
matched the detected edge.