ー 105 ー
Operating Instructions Intelligent Controller
118
Displaying data in graphs
Energy saving
13
Touch to add to the display item list.
13
14
Repeat steps 11 to 13 to select the
display items.
z You can add up to 4 display items.
z To delete from the display item list, select the display item
and touch
.
15
Set the goal values for the axis.
z Touch [Ax1TgtVal] or [Ax2TgtVal] and enter the numbers
with the touchscreen numeric keypad.
z A red line is inserted to indicate the goal values for the
graph.
z You can set any goal.
15
16
Touch [GraphDsp].
z The graph is displayed in the main screen.
z To cancel the settings, touch [Cancel].
16
Setting items freely
119
Displaying data in graphs
Energy saving
1
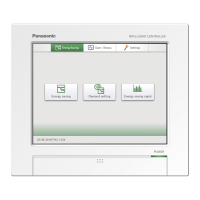
Touch [Energy saving mgmt] in
“EnergySaving”.
1
2
Select the type of graph.
z The main screen is displayed.
2
3
Select the graph group (3-1) and touch
[GrphDspSetgs] (3-2).
z The display settings screen is displayed.
3-
2
3-
1
4
Make the graph display settings.
z Follow steps 4 to 14 in “Making the settings” (P.116 to 118)
to make the graph display settings.
5
Touch [Reg. Graph Grp].
z The message “OK to overwrite [GraphGroupXX]?” (XX
is the setting number of the selected graph group) is
displayed.
5
6
Touch [Register].
z The setting is registered.
z To cancel registration, touch [Cancel].
6
Setting items freely
Registering as a graph group
TGR-318_ENG.indb 105 2017/04/06 10:43:51
 Loading...