8
D1VW_EE 5715-690 UK.indd 11.07.22
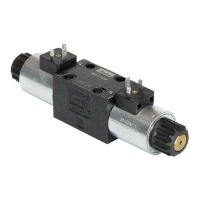
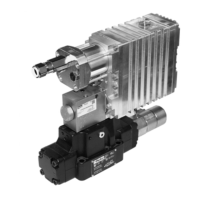
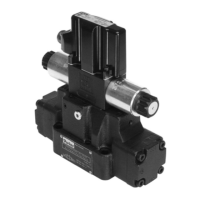
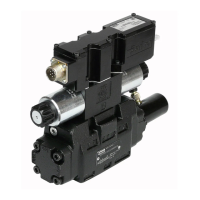
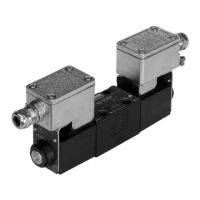
Directional Control Valve
Series D1VW Explosion Proof
Operating Instructions
Parker Hannin Corporation
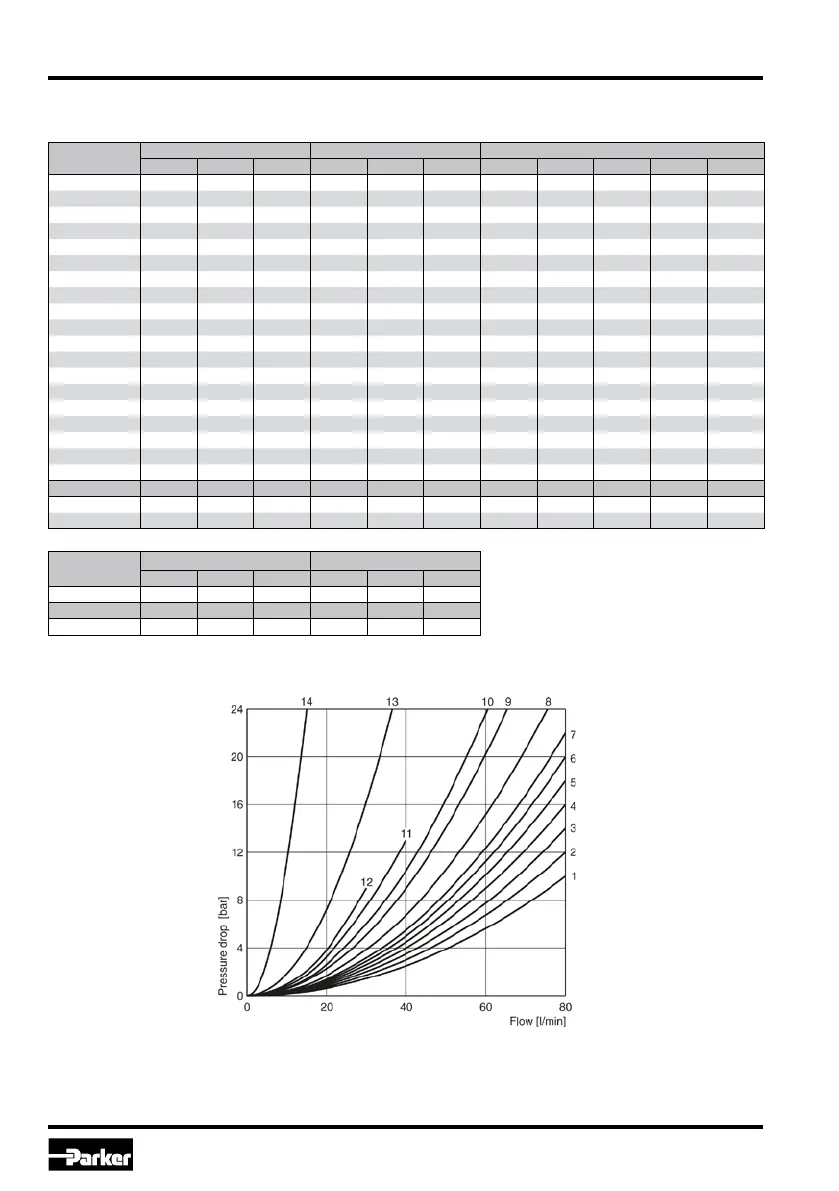
Flow curve diagram
The ow curve diagram shows the ow versus pressure drop curves for all spool types. The relevant
curve number for each spool type, operating position and ow direction is given in the table below.
Spool
Position “b” Position “a” Position “0”
P-A B-T P-B P-B A-T P-A P-A P-B A-T B-T P-T
001 2 2 2 2
002 1 4 1 4 1 1 5 5 2
003 3 4 3 6 7
004 2 3 2 3 7 7
005 2 2 2 2 12
006 1 4 1 4 7 7
007 3 2 2 2 3 2 7
010 3 3
011 2 2 2 2 14 14
014 3 2 2 2 3 2 7
015 3 6 3 4 7
016 2 2 2 2 12
020B 4 4 2 3
026B 4 4
030B 2 3 1 2
081 13 13 13 13
082 13 13 13 13
1) 1)
101B 11 10 10 9
102 1 4 1 4 5 5 8 8 6
P-B A-T P-A B-T P-A P-B A-T B-T P-T
008 4 5 4 5 9
009 5 5 6 7 7
Spool
Position “b” Position “a”
P-A P-B A-B P-B A-T
021 2 4 4 2
P-A B-T P-A P-B A-B
022 6 2 5 2
All characteristic curves measured with HLP46 at 50 °C.
1)
Only for pressure compensation, no high ow possible.
 Loading...