PENNBARRY
17
Belt Drive Fan Data
Breezeway
Performance Data
The belt drive models shown on the following pages have
sizes and capacities ranging from below 3,000 CFM to nearly
70,000 CFM, with static pressures from 0" to above 1 1/2".
All models are available in several different horsepower sizes
with a wide range of RPM.
The data provided for each belt drive model includes:
• Tabular performance data
• Fan curve
• Dimensional and physical data
Each curve graphically displays the range of capacities
available for each model, in most cases beyond the specifi cs
shown in the tabular data. The maximum performance afforded
by each horsepower is indicated by dashed lines and the RPM
is indicated by solid lines.
Refer to the appropriate Motor Availability chart (see Motor
Selection section) to confi rm available motors.
The belt drive models have graphs that show both shaded
and unshaded areas. Caution should be used when making
selections in the shaded areas.
The highest RPM shown for a specifi c horsepower in the
tabular data is the maximum speed that for any point along
the performance curve, the BHP will not exceed the available
horsepower.
Always consider belt drive losses into the BHP calculations
to ensure proper motor selection. PennBarry fan selection
software ALWAYS accounts for these losses. See ‘Belt Drive
Losses’ section, following, for an explanation of this topic.
Note: Breezeway fans are only one component of a total system. As such,
performance is directly affected by the system. It is critical that system designers
determine actual system losses to ensure that the actual fl ow is specifi ed in the
system range.
Belt Drive Losses
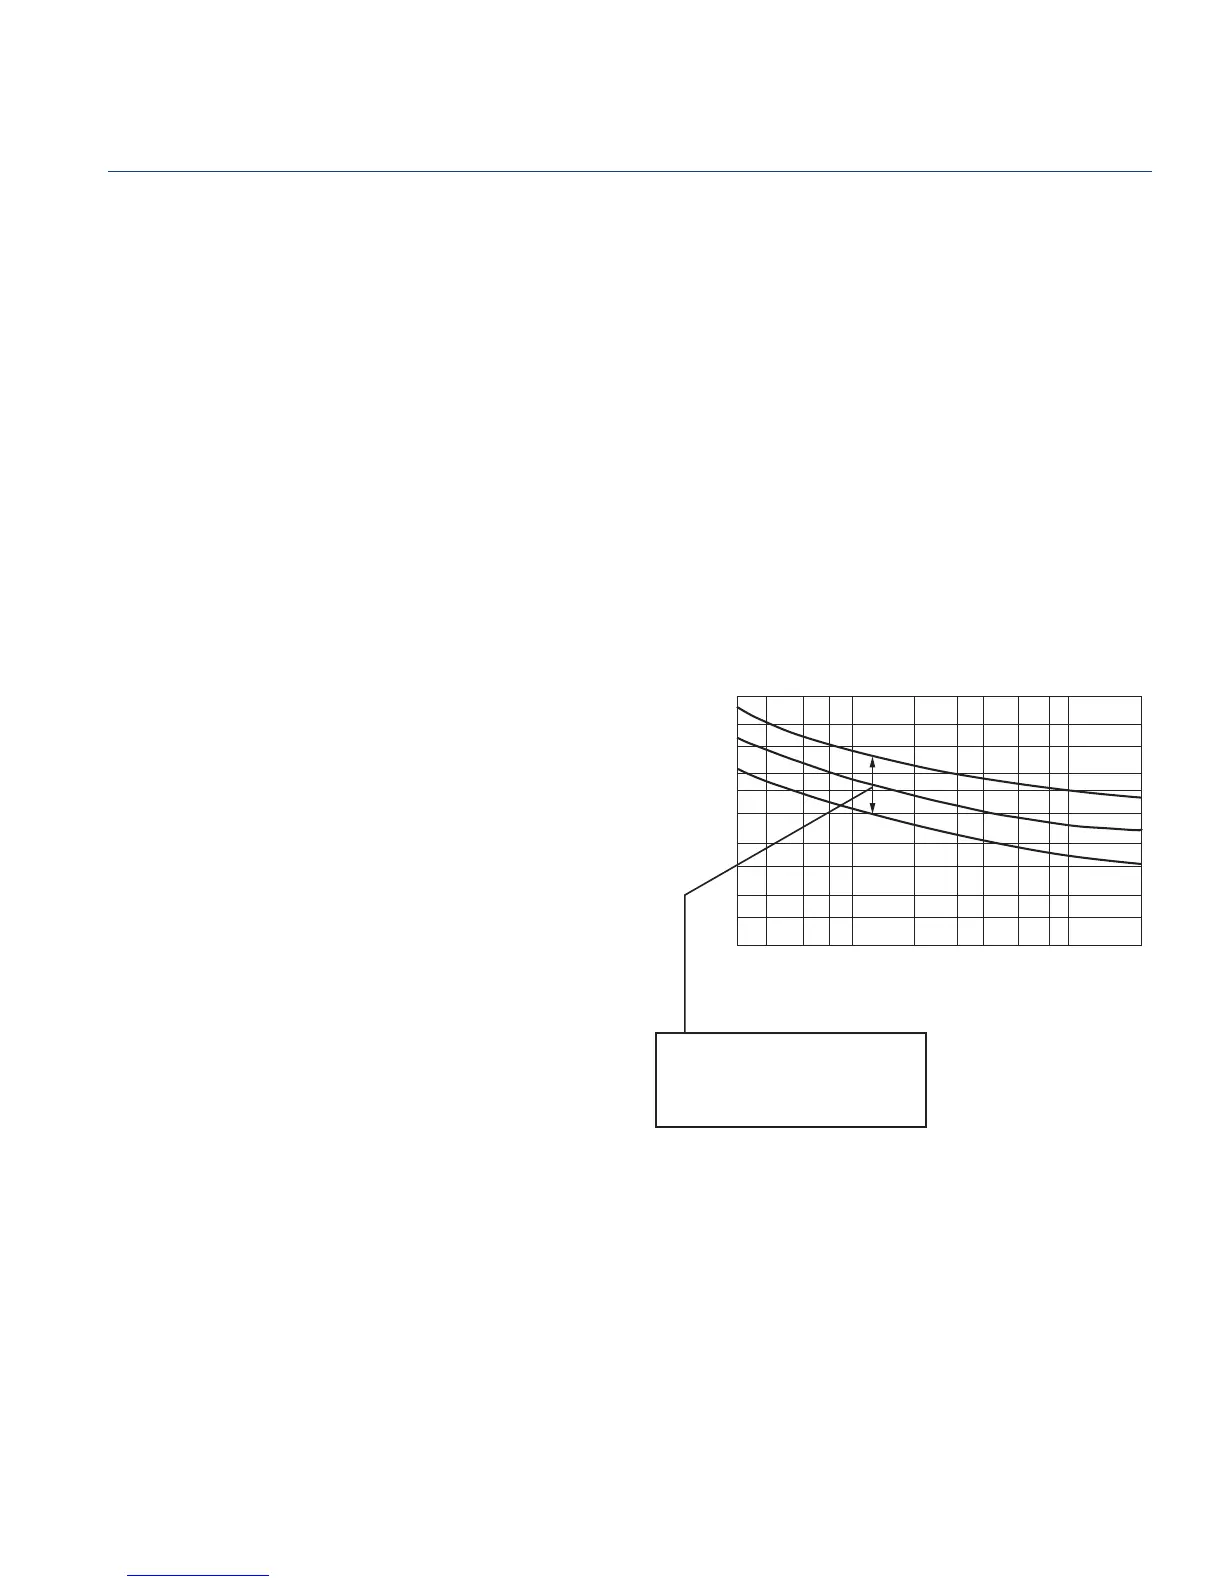
The AMCA Review Committee has developed the chart
shown below for the purpose of estimating belt drive losses.
To calculate total BHP (including drive losses): Find the BHP
of your operating point on the x-axis on the graph below.
Follow the vertical line to the lines indicating the range of drive
losses. Look at the y-axis on the left and fi nd the drive loss
percentage. Calculate the total BHP by adding the drive loss
to the operating point BHP. For BHP’s below 0.3, use 30%.
Caution: For totally enclosed, explosion proof, multi-speed
and all 1.0 Service Factor motors, fan BHP plus drive losses
should not exceed motor rated HP.
Note: FanSizer software incorporates a drive loss allowance when selecting a
required nominal horsepower.
Reprinted from AMCA publication 203, with the express written permission
from the Air Movement and Control Association, Inc., 30 West University Drive,
Arlington Heights, IL 60004-1983
0.3 0.4 0.6 0.8 1 2 3 4 6 8 10 20
30
20
15
10
8
6
4
3
2
1
1.5
Motor Power Output (BHP)
Drive Loss
(% Motor Power Output)
Safety Precautions for Installation
Since Breezeway fans contain rotating parts, PennBarry
recommends the following safety precautions be taken
during installation, operation and maintenance. Install FAN
GUARDS on all non-ducted fan installations to protect
people working around the fan and to protect the fan from
foreign objects coming into contact with moving parts. For
proper and safe operation, fan RPM should not exceed
that recommended in performance tables. Installations that
result in EXCESSIVE VIBRATION are unacceptable.
Range of drive loss for standard
belts. Higher fan speeds tend to
have higher losses than lower fan
speeds at the same horsepower.
 Loading...