PENNBARRY
40
Sound Power Levels
Since any mechanical device generates some sound energy
into the air, fans will create some noise. Because of the great
number of factors infl uencing sound output it is invalid to
compare fans based on RPM, tip speed or outlet velocity. The
only accurate basis of comparison is the sound power level
generated by the fan at the required point of operation.
Having sound power levels for a specifi c fan at a specifi c
operating point allows the system designer to determine the
theoretical sound pressure level at any point in the occupied
space. AMCA Publication 303 and the ASHRAE Guides
provide more information on this process. Another typical
application of sound power levels is to compare similar fans.
Generally differences of 6 dB in the 63 Hz band and 3 dB in
all other bands are considered insignifi cant.
System designers use many methods to predict acoustic
acceptability of an occupied space.
The A-weighted sound pressure level provides a single
number that corresponds well to the human judgement of
relative loudness. OSHA bases their requirements regarding
exposure to noise on A-weighted sound pressure levels. The
disadvantage of this method is that A-weighted sound pressure
levels do not provide information as to the quality of the sound.
Noise Criteria (NC) curves are also widely used. To determine
the NC level, the sound power spectrum is compared to
defi ned limits. Other methods include RC curves, Sones, SIL
and Noise Rating Curves.
Each method relies on sound pressure level information
because the human ear “hears” sound pressure fl uctuations,
not sound power (watts). Sound pressure is a function of the
attenuation of the space and the distance from the source.
Consider a 100 watt light bulb. It provides adequate light for
a closet, but not for a classroom, and in a stadium it would
be imperceptible. While the light source was the same power
(100 watts), the brightness level changed dramatically.
Similarly, the same sound power level (acoustical energy)
produces greatly different sound pressure levels (noise).
Sound power levels shown in this catalog were measured
and certifi ed using AMCA standard 300 Reverberant Room
Method for Sound Testing of Fans. The values shown are for
the eight octave bands defi ned in this standard, which agree
with ANSI 61.11-1986. One-third octave band sound power
levels shown are rated in decibels (dB) using 10-12 watts as
a reference.
Sone Ratings
In addition to sound power levels, PennBarry has provided
sone ratings to allow designers to make an educated judgment
as to the noise level a fan will develop in a space. Sone
ratings are a loudness index developed from sound power
level data. The calculation is at 5’ from the fan inlet and in
front of a refl ecting plane (hard wall). Sones are weighted
similarly to the A-weighting scale in that more weight is given
to frequencies that people can hear “well” and less weight to
frequencies that people do not hear “well”. A signifi cant feature
of the sone scale is that it is linear rather than logarithmic.
This means that 40 sones is 33% louder than 30 sones, as
opposed to 40 dB being twice as loud as 30 dB.
Since the sone rating is determined from well defined
assumptions and is linear in nature, it is ideal for comparing
different fans moving air at the same CFM and SP. When using
sones for this purpose, differences of 3 sones are considered
negligible. The suggested loudness level chart below is a
practical guideline for acceptable installed performance.
The sone values shown in this catalog are based on the sound
power levels determined above, and calculated in accordance
with AMCA Standard 301 “Methods for Calculating Fan Sound
Ratings from Laboratory Test Data.”
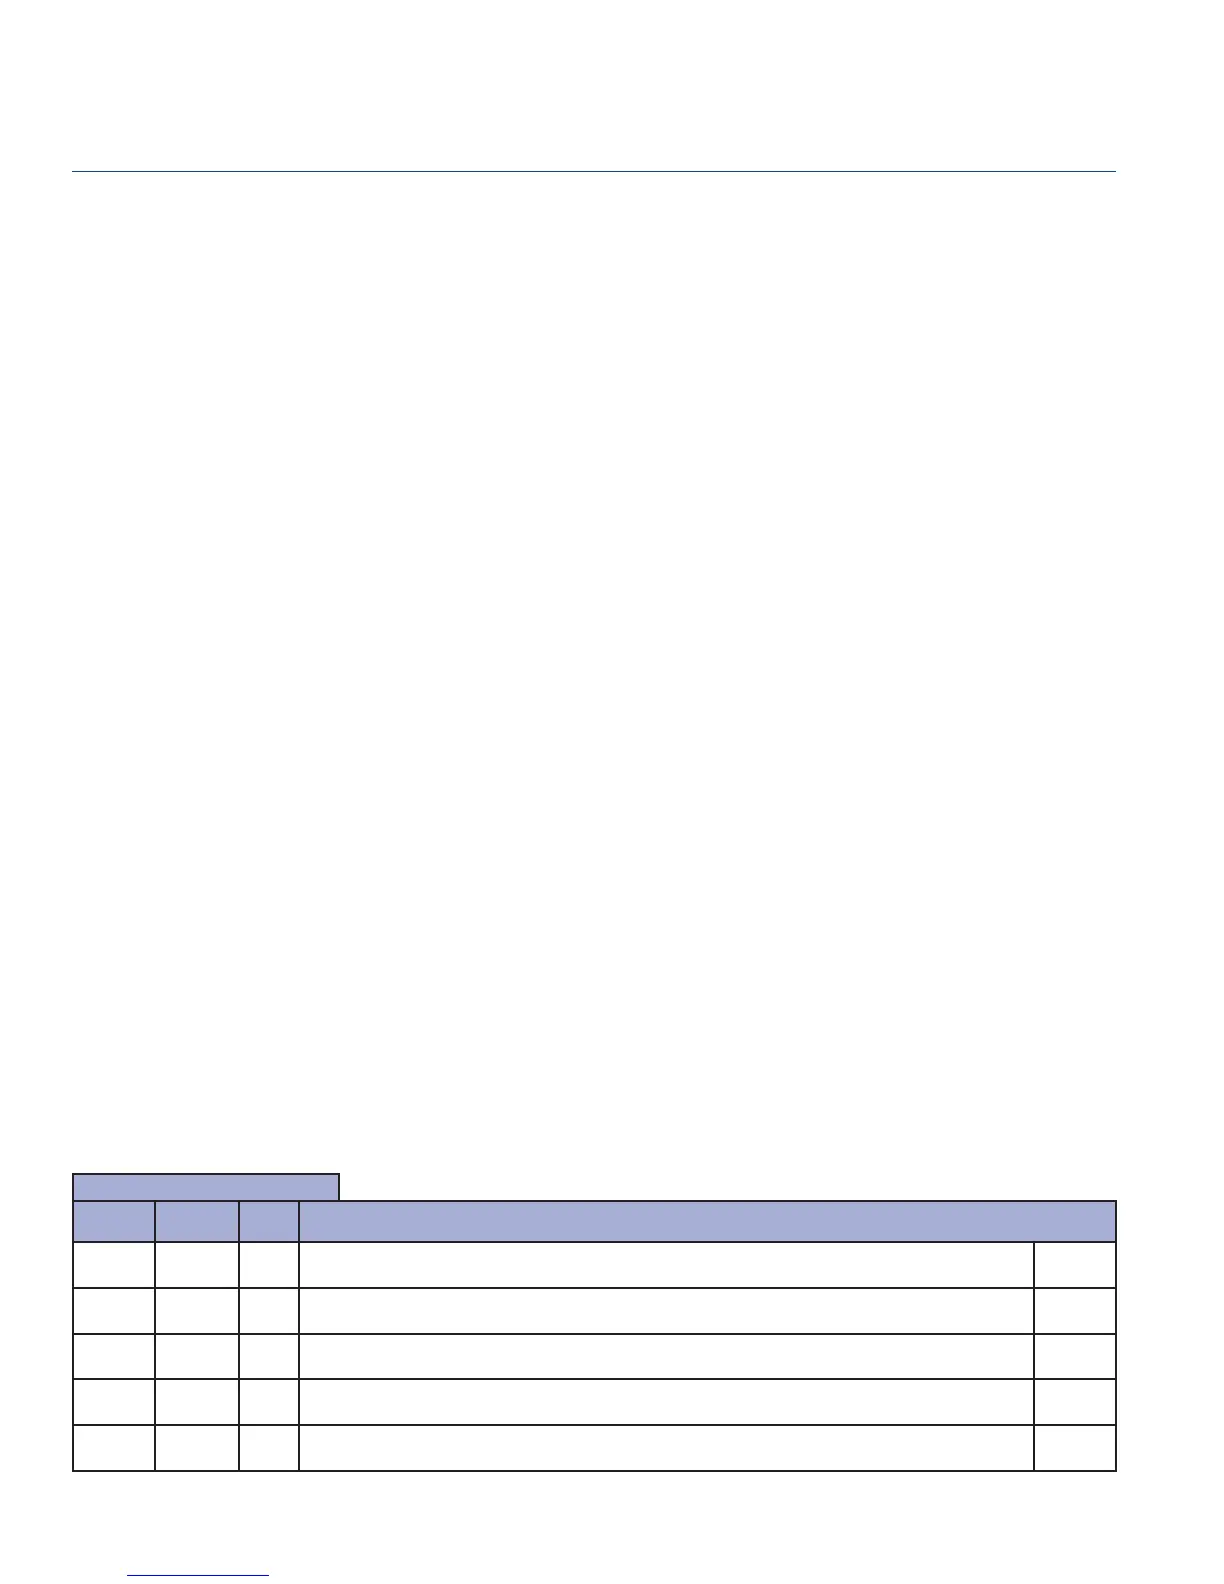
Sound Classifi cation Guide
Notes: (1) dBA range of A-weighted sound levels, in decibels.
AREA SONE
LEVEL
NOISE
CRITERIA
NC
dBA (1) TYPES OF AREAS
Up to 9 32 to 54 35 to 60
Bingo Hall, Auction Room, Hotel Ballroom, Social Club, Reception Room, Apartment House, Professional Offi ce, Supervisor Offi ce,
Courtroom, School and Classroom, Hospital Ward, Operating Room, Correction Facility.
Moderately
Quiet Sound
9.1 to 13 55 to 59 61 to 65
Lobby/Corridor, Spectator Area, Chicken House, Greenhouse, General Open Offi ce, Restaurant, Night Club, Department Store, Ticket
Sales Offi ce, Casino, Spa, Control Room, Rail, Bus, Plane, Bowling Alley, Print Shop, Drafting Offi ce, Convention Hall
Average
13.1 to 18 60 to 64 66 to 70
Washroom & Toilet, Retail Shop, Bus Terminal Lounge, Foreman’s Offi ce, Cocktail Lounge, Offi ce Hall & Corridor, Tabulation &
Computation Offi ce, Kitchen Cafeteria, Hotel Garage, Computer Room, Warehouse, Battery Charging Room
Commercial
18.1 to 50 65 to 78 71 to 84
General Storage Area, Restaurant Banquet Room, Swimming Pool, Supermarket, Hotel Kitchen and Laundry, Welding Booth,
Department Store Main Floor, Paint Booth, Heat Treating Plant, Tool Maintenance Area
High Sound
50.1 Plus 78.1 to 85+
84.1 to
90+ (2)
Manufacturing Area, Heavy Machine Foundry, Assembly Line, Machine Shops, Punch Press Shop, Light Machine Area, Boiler Room,
Emergency Generator Room, Pump House, Power Plant, Transformer, Steel Mill, Engine Test Room, Compressor Room, Steel Stamping
Ext. Heavy
Industrial
SUGGESTED LOUDNESS LEVEL
Sound Data Notes
Breezeway
(2) Sound levels this high subject to OSHA Standards for safety, as well as state
and local ordinances. Sound attenuation provisions should be considered.
Source: ASHRAE, AMCA Publications
 Loading...