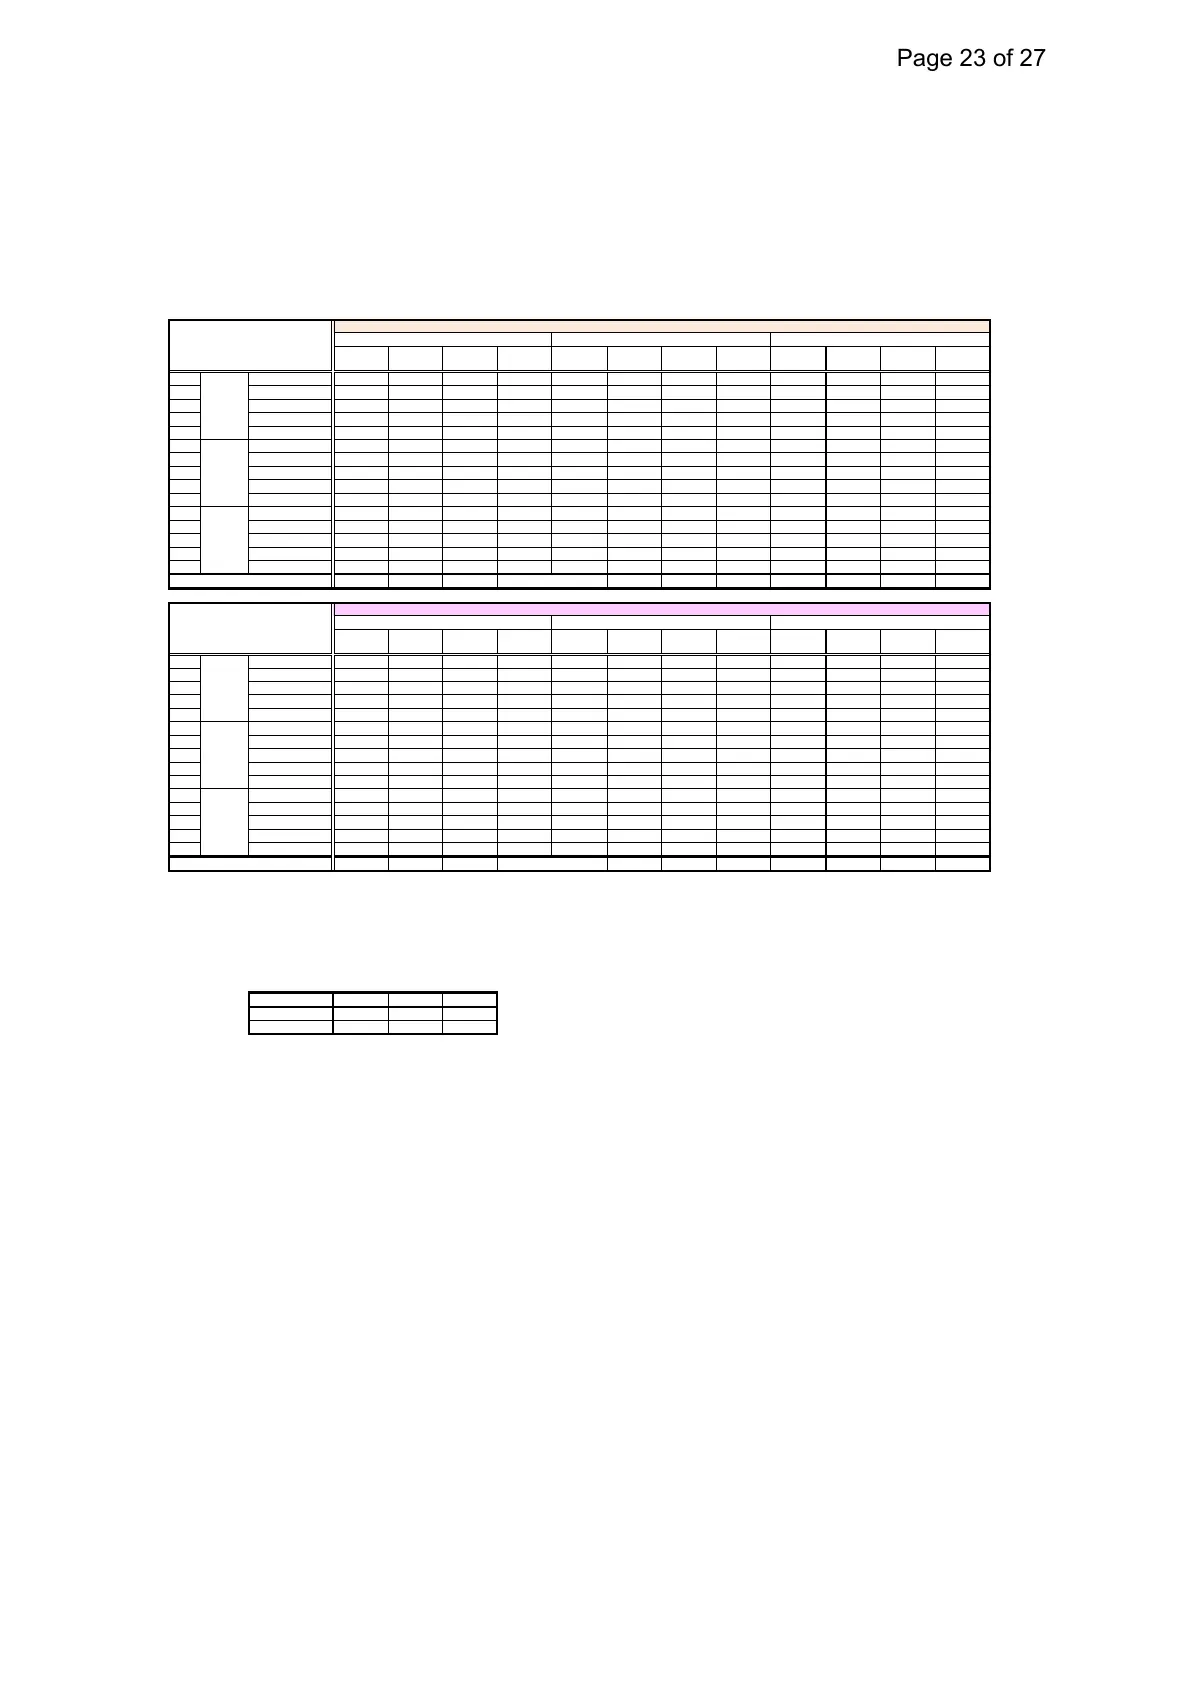
Temperature of the cycle in each area (SV=-70℃、air temperature)
Differential Maximum Minimum
Differential Maximum Minimum
Differential
①
Left back
-68.3 -72.3 -70.3 ±2.0 -68.2 -72.3 -70.3 ±2.1 -68.1 -72.2 -70.2 ±2.1
②
Right back
-68.5 -72.1 -70.3 ±1.8 -68.5 -72.1 -70.3 ±1.8 -68.4 -72.0 -70.2 ±1.8
③
Right front
-68.7 -72.2 -70.5 ±1.8 -68.6 -72.3 -70.5 ±1.8 -68.6 -72.2 -70.4 ±1.8
④
Left front
-68.6 -72.3 -70.5 ±1.8 -68.5 -72.4 -70.5 ±2.0 -68.5 -72.2 -70.4 ±1.9
⑤
Center
-68.6
-71.4 -70.0 ±1.4
-68.5
-71.5 -70.0 ±1.5 -68.5 -71.4 -70.0 ±1.5
⑥
Left back
-69.1 -72.3 -70.7 ±1.6 -69.0 -72.4 -70.7 ±1.7 -69.0 -72.3 -70.7 ±1.7
⑦
Right back
-68.8 -71.9 -70.4 ±1.6 -68.7 -72.0 -70.4 ±1.7 -68.7 -71.9 -70.3 ±1.6
⑧
Right front
-68.9 -72.2 -70.6 ±1.7 -69.0 -72.3 -70.7 ±1.7 -68.9 -72.2 -70.6 ±1.7
⑨
Left front
-69.0 -72.0 -70.5 ±1.5 -69.0 -72.1 -70.6 ±1.6 -68.9 -72.0 -70.5 ±1.6
⑩
Center
-69.5
-71.6 -70.6 ±1.1
-69.4
-71.7 -70.6 ±1.2 -69.3 -71.7 -70.5 ±1.2
⑪
Left back
-69.1 -72.0 -70.6 ±1.5 -69.0 -72.0 -70.5 ±1.5 -69.0 -72.0 -70.5 ±1.5
⑫
Right back
-68.7 -71.8 -70.3 ±1.6 -68.6 -71.8 -70.2 ±1.6 -68.7 -71.9 -70.3 ±1.6
⑬
Right front
-68.6 -71.8 -70.2 ±1.6 -68.6 -71.8 -70.2 ±1.6 -68.5 -71.8 -70.2 ±1.7
⑭
Left front
-69.0 -72.1 -70.6 ±1.6 -69.0 -72.1 -70.6 ±1.6 -68.9 -72.1 -70.5 ±1.6
⑮
Center
-69.1 -71.3 -70.2 ±1.1 -69.0 -71.4 -70.2 ±1.2 -68.9 -71.3 -70.1 ±1.2
- - -70.4 - - - -70.4 - - - -70.3 -
Differential Maximum Minimum
Differential Maximum Minimum
Differential
①
Left back
-68.2 -72.1 -70.2 ±2.0 -68.1 -72.1 -70.1 ±2.0 -68.2 -72.1 -70.2 ±2.0
②
Right back
-68.4 -71.9 -70.2 ±1.8 -68.4 -71.9 -70.2 ±1.8 -68.4 -72.0 -70.2 ±1.8
③
Right front
-68.7 -72.2 -70.5 ±1.8 -68.6 -72.2 -70.4 ±1.8 -68.6 -72.2 -70.4 ±1.8
④
Left front
-68.5 -72.2 -70.4 ±1.9 -68.5 -72.2 -70.4 ±1.9 -68.6 -72.3 -70.5 ±1.8
⑤
Center
-68.6
-71.5 -70.1 ±1.5
-68.6
-71.5 -70.1 ±1.5 -68.6 -71.5 -70.1 ±1.5
⑥
Left back
-69.1 -72.2 -70.7 ±1.6 -69.1 -72.2 -70.7 ±1.6 -69.1 -72.3 -70.7 ±1.6
⑦
Right back
-69.0 -72.1 -70.6 ±1.6 -69.0 -72.1 -70.6 ±1.6 -69.0 -72.1 -70.6 ±1.6
⑧
Right front
-69.1 -72.3 -70.7 ±1.6 -69.0 -72.3 -70.7 ±1.7 -69.1 -72.4 -70.8 ±1.7
⑨
Left front
-69.2 -72.2 -70.7 ±1.5 -69.2 -72.2 -70.7 ±1.5 -69.2 -72.2 -70.7 ±1.5
⑩
Center
-69.6
-71.8 -70.7 ±1.1
-69.6
-71.8 -70.7 ±1.1 -69.6 -71.8 -70.7 ±1.1
⑪
Left back
-69.0 -72.0 -70.5 ±1.5 -69.0 -71.9 -70.5 ±1.5 -69.0 -72.0 -70.5 ±1.5
⑫
Right back
-68.6 -71.8 -70.2 ±1.6 -68.7 -71.8 -70.3 ±1.6 -68.7 -71.8 -70.3 ±1.6
⑬
Right front
-68.6 -71.8 -70.2 ±1.6 -68.6 -71.8 -70.2 ±1.6 -68.6 -71.7 -70.2 ±1.6
⑭
Left front
-69.0 -72.1 -70.6 ±1.6 -69.0 -72.1 -70.6 ±1.6 -68.9 -72.2 -70.6 ±1.7
⑮
Center
-69.1 -71.4 -70.3 ±1.2 -69.0 -71.5 -70.3 ±1.3 -69.0 -71.4 -70.2 ±1.2
- - -70.4 - - - -70.4 - - - -70.4 -
<Amount of power consumption>
Amount of power consumption when driving at cycle
1φ220/230/240V
Unit:kWh/day
Note:This data does not represent a guarantee
of product performance.
Note:This data does not represent a guarantee of product performance.



 To Next Page