Eagle™ Power Quality Recorder User’s Manual •
••
• v
Table of Figures
Figure 1 – The Eagle™ Recorders ........................................................... 9
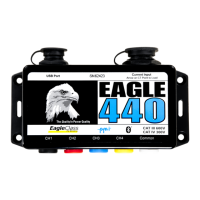
Figure 2 – The Eagle 440™ .................................................................... 11
Figure 3 – Eagle™ USB Communications Cable ................................... 13
Figure 4 – TLAR Current Clamps............................................................ 14
Figure 5 – Ultra-Slim Flexible CTs .......................................................... 14
Figure 6 – Voltage Clips .......................................................................... 15
Figure 7 – Eagle™ Input Diagram........................................................... 23
Figure 8 – Eagle™ Hookup Diagrams .................................................... 24
Figure 9 – Eagle™ Input Diagram........................................................... 25
Figure 10 – A Laptop Computer Running ProVision
®
............................. 31
Figure 11 – PMI Field PC ........................................................................ 33
Figure 12 – A Palm
®
PDA Running pmiScan™ ...................................... 35
Figure 13 – RMS Voltage and Current Interval Graph ............................ 40
Figure 14 – RMS Voltage Daily Profile Graph ........................................ 44
Figure 15 – RMS Voltage Cycle Histogram Report ................................ 47
Figure 16 – Energy Usage Report .......................................................... 51
Figure 17 – Significant Change Report ................................................... 53
Figure 18 – Event Change Table Report ................................................ 56
Figure 19 – Event Capture Edit Settings Window ................................... 57
Figure 20 – Power Outage Report .......................................................... 60
Figure 21 – Flicker Report ....................................................................... 61
Figure 22 – Abnormal Voltage Report .................................................... 63
Figure 23 – Loose Neutral Report ........................................................... 66
Figure 24 – Waveform Capture Edit Settings Window............................ 68
Figure 25 – Typical Waveform Capture .................................................. 69