EasyManuals Logo

Quest Engineering OB-100 User Manual

Default Icon
25 pages
To Next Page IconTo Next Page
To Previous Page IconTo Previous Page
Page #14 background imageLoading...
Page #14 background image
25
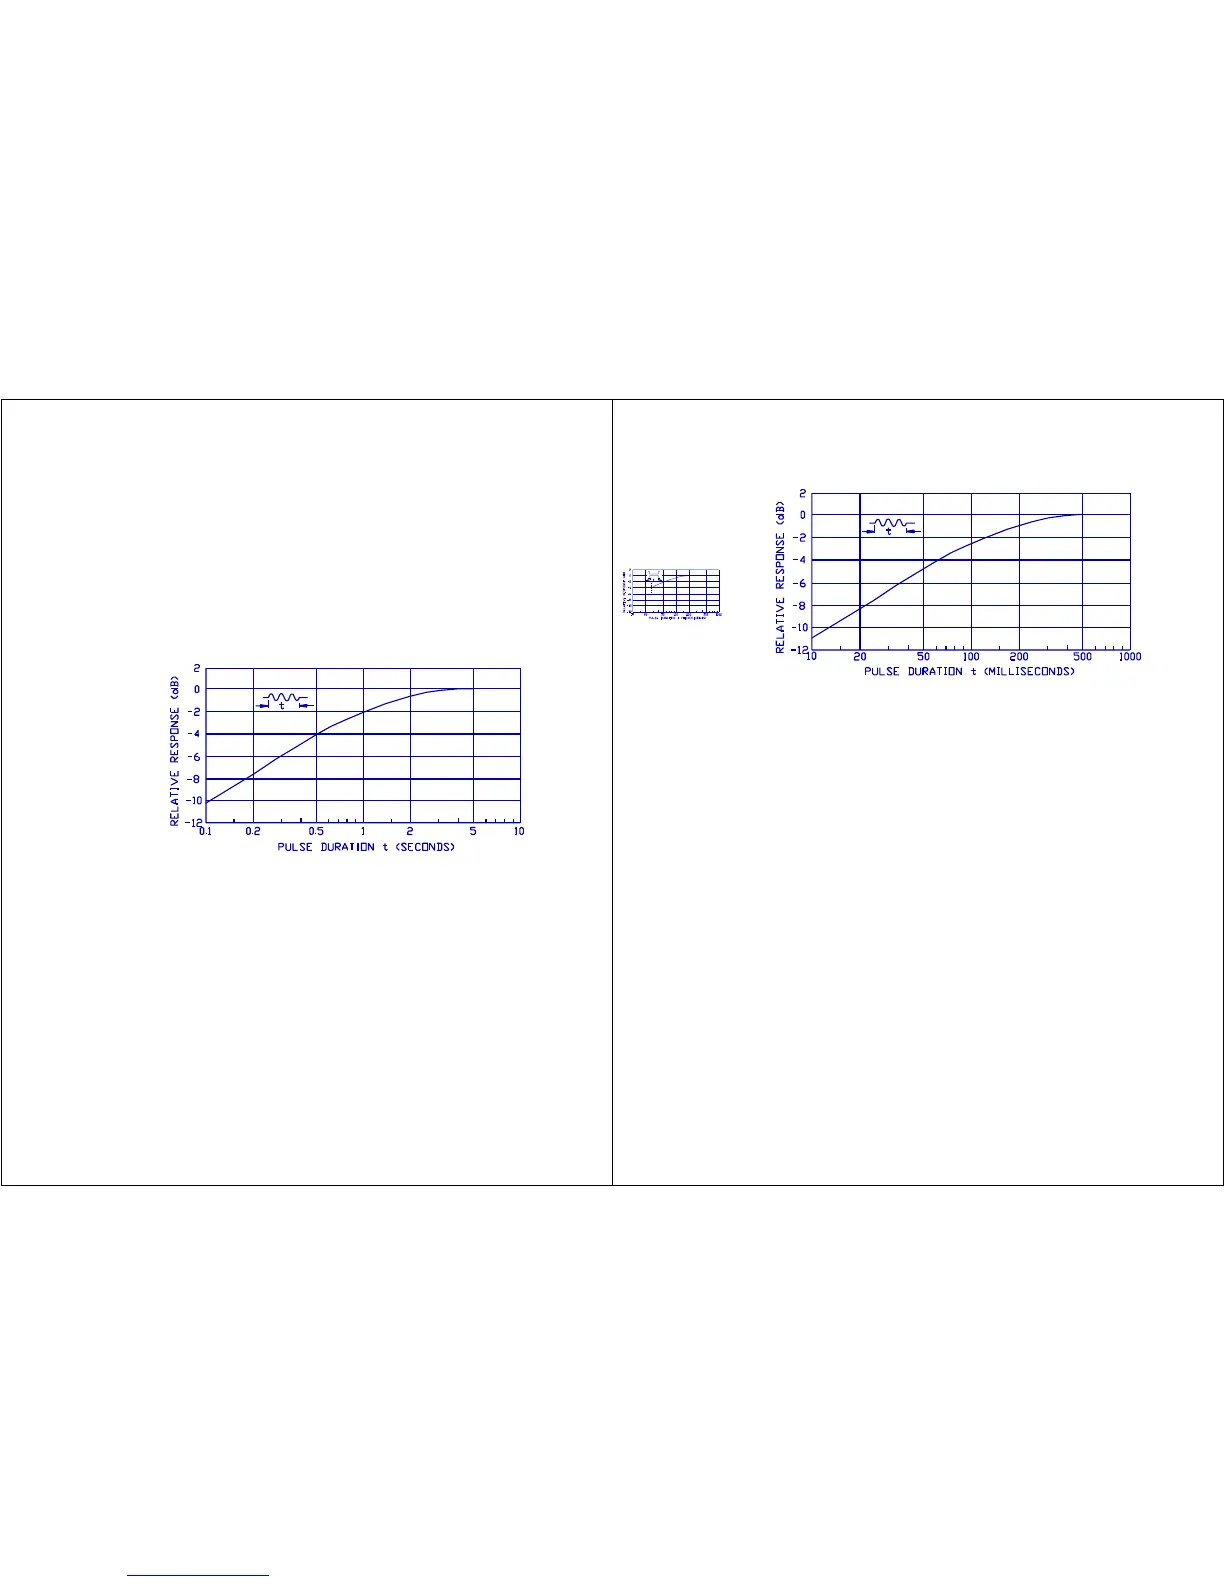
Figure 18. SLOW Response
H. Response Charts
Figures 18 through 22 are plots for each of the response settings of the
meter. They show how the meter responds to a given sinewave input of varied
pulse duration.
SLOW RESPONSE (1000 msec time constant) Figure 18.
FAST RESPONSE (125 msec time constant) Figure 19.
PEAK RESPONSE (50 microsecond time constant) Figure 20.
IMPULSE RESPONSE (35 msec rise time constant with a decay rate of
2.9 dB/sec) Figure 21 and Figure 22.
26
Figure 19. FAST Response
Figure 20.
PEAK Response

Table of Contents

Questions and Answers:

Question and Answer IconNeed help?

Do you have a question about the Quest Engineering OB-100 and is the answer not in the manual?

Quest Engineering OB-100 Specifications

General IconGeneral
BrandQuest Engineering
ModelOB-100
CategoryMusic Equipment
LanguageEnglish

Related product manuals