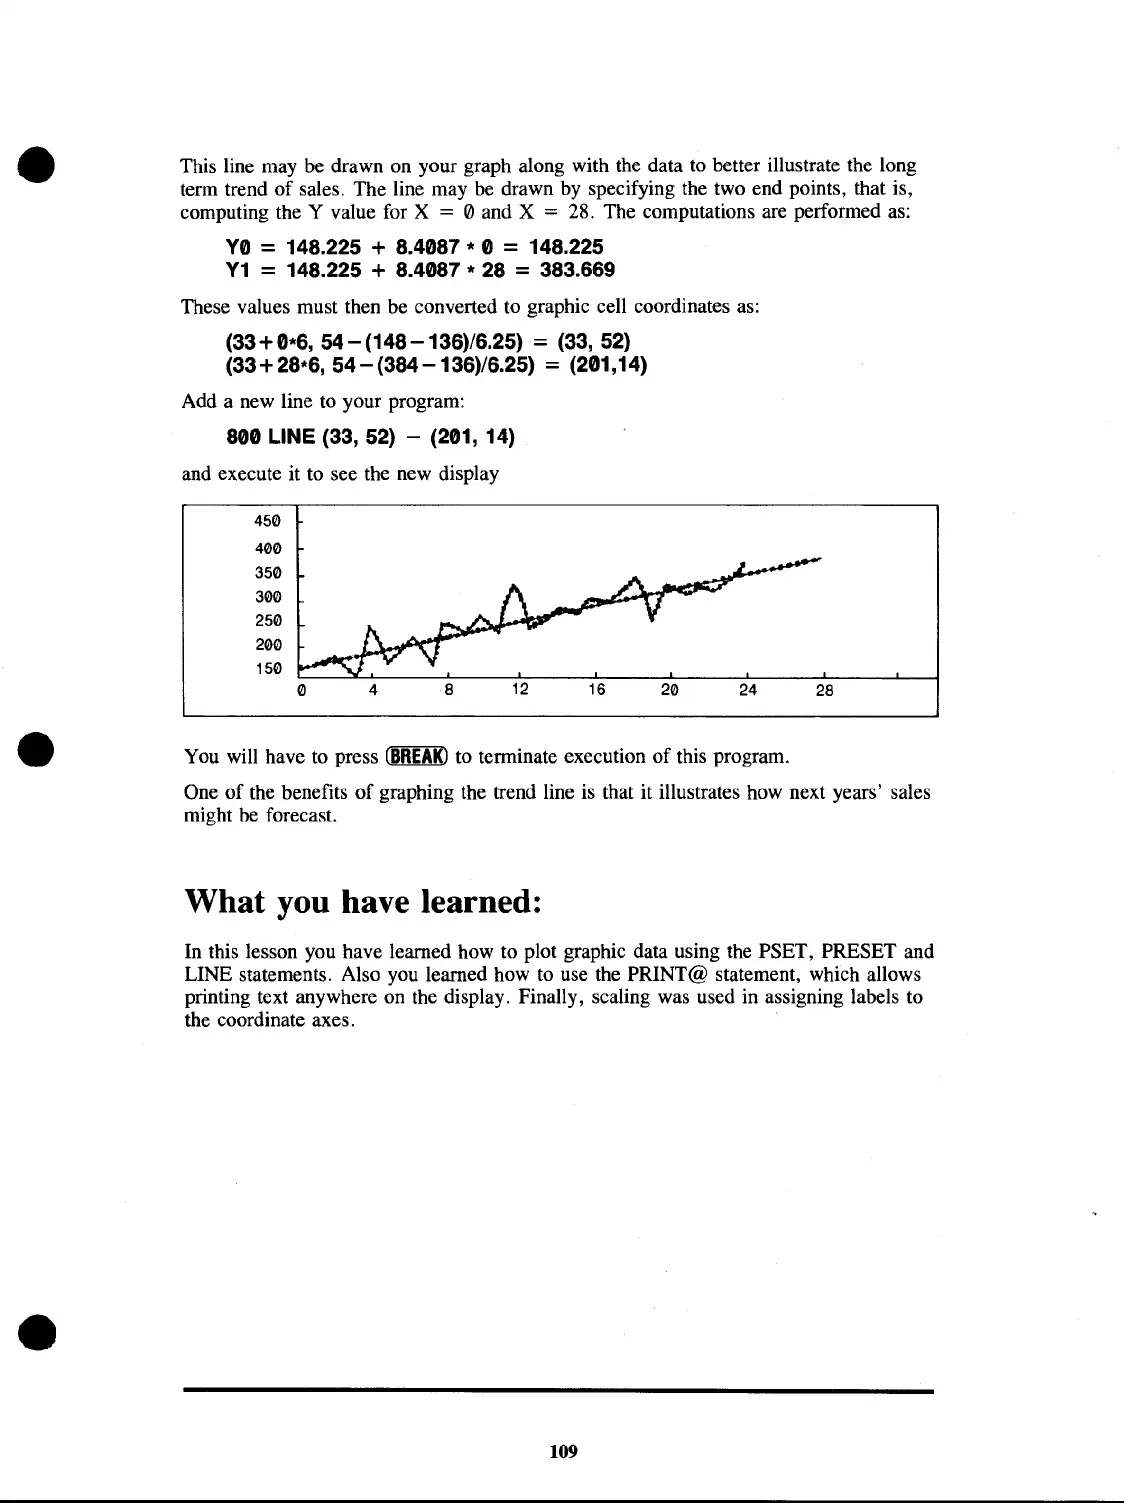
This line may be drawn on your graph along with the data to better illustrate the long
term trend of sales. The line may be drawn
by
specifying the two end points, that is,
computing the Y value for X
=
(/)
and X = 28. The computations are performed
as:
Y0 = 148.225 + 8.4087 * 0 = 148.225
Y1
= 148.225 + 8.4087 * 28 = 383.669
These values must then be converted to graphic cell coordinates
as:
(33 + 0*6, 54 - (148
-136)/6.25)
= (33, 52)
(33
+28*6, 54 - (384 - 136)/6.25) = (201,14)
Add a new line to your program:
800 LINE (33, 52) - (201, 14)
and execute
it
to see the new display
450
400
350
300
250
200
150
o
4
8
24
28
You will have to press
(BREAK)
to terminate execution of this program.
One of the benefits of graphing the trend line
is
that it illustrates how next years' sales
might he forecast.
What you have learned:
In this lesson you have learned how to plot graphic data using the PSET, PRESET and
LINE statements. Also you learned how to use the PRINT@ statement, which allows
printing text anywhere on the display. Finally, scaling was used in assigning labels to
the coordinate axes.
109
 Loading...