230
225
325
280
345
380
140,
155,
220,
285,
255,
315,
800
PSET
(34,Y)
:
NEXT
Y
700
FOR
X = 0
TO
28
STEP 4
710
PRINT@
284+X,X;
:
NEXT
X
720
FOR
Y = 1
TO
7
730
PRINT@
280-Y*40,
100+Y*50
740
NEXT
Y
745
PSET
(38,50)
750
FOR
X = 1
TO
24
:
READ
Y
780
LINE
-(33+X*8,
54-(Y-138)/8.25)
770
NEXT
X
800
DATA
180, 175,
810
DATA
155,
215,
820
DATA
215,
285,
830
DATA
225,
270,
840
DATA
275,
350,
850
DATA
300,
330,
2000
GOTO
2000
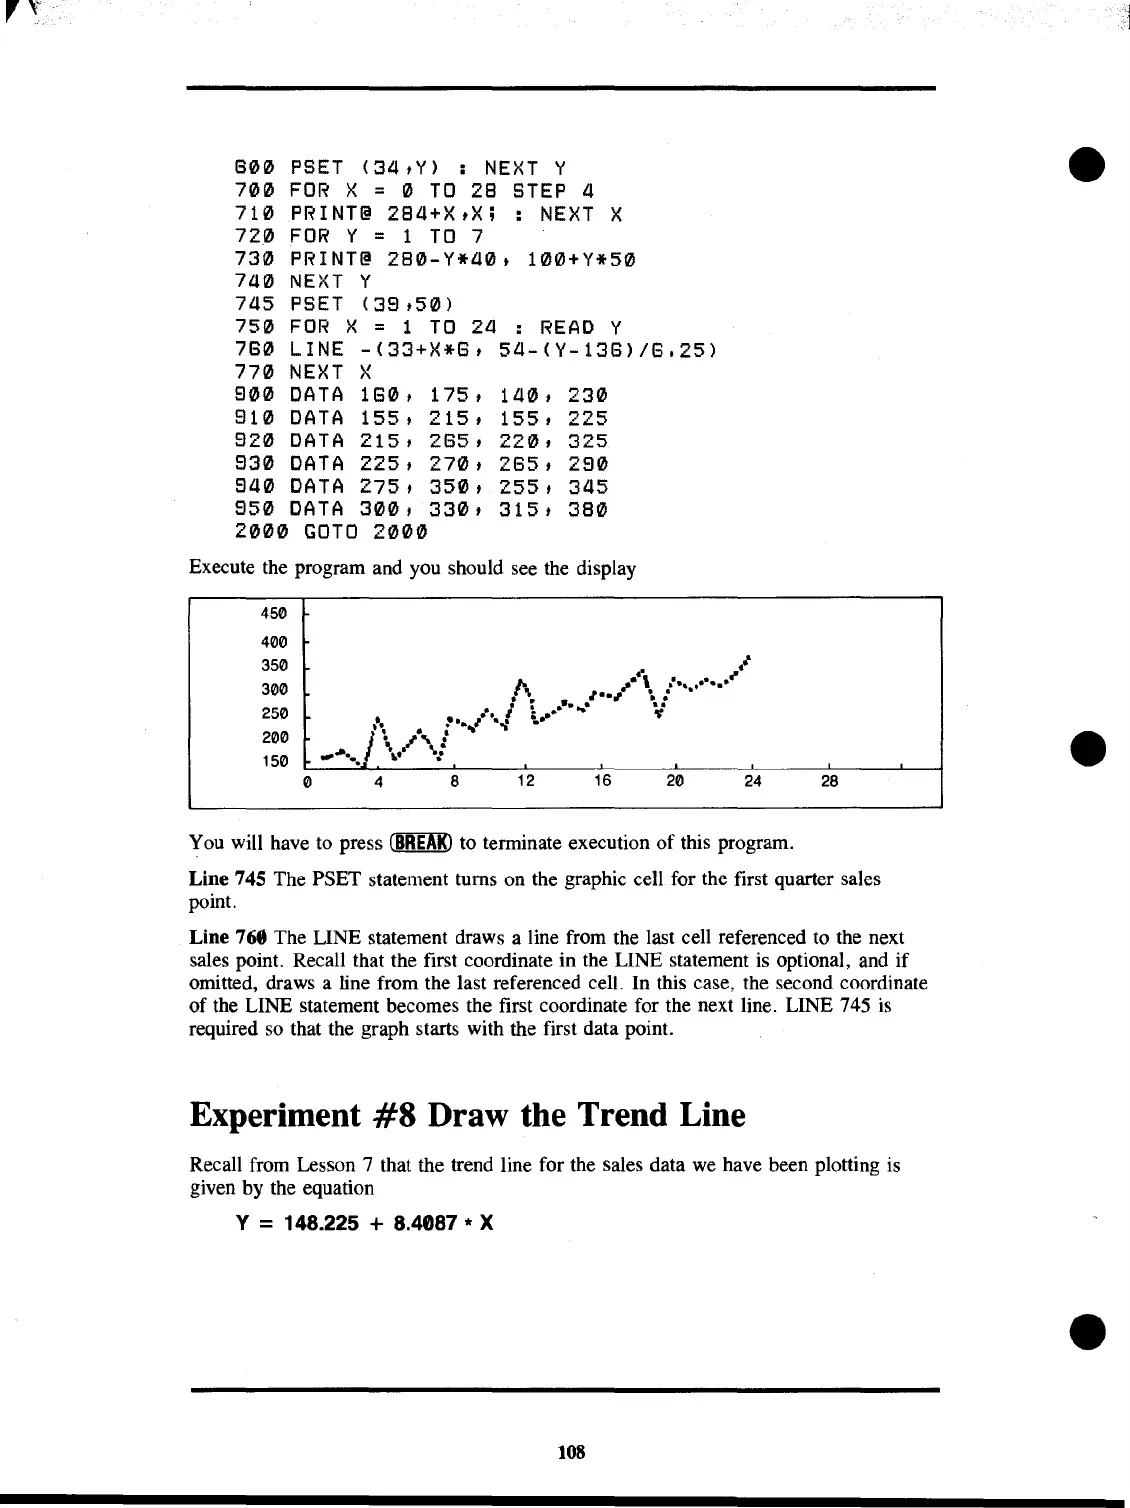
Execute the program and you should see the display
l
0':\
..
A
..
- • :
••••••••••
I'.
~
..
, II •
1'.
J :
a,;
"',
.
..
..
."
-.,
.
1
\/\:
..........
...
-:
450
400
350
300
250
200
150
o
4
8
12
16
20
24
28
You will have
to
press
~
to terminate execution
of
this program.
Line 745 The PSET statement turns on the graphic cell for the first quarter sales
point.
Line 768 The LINE statement draws a line from the last cell referenced
to
the next
sales point. Recall that the first coordinate in the LINE statement
is
optional, and
if
omitted, draws a line from the last referenced cell. In this case, the second coordinate
of the LINE statement becomes the first coordinate for the next line. LINE 745
is
required
so
that the graph starts with the first data point.
Experiment
#8
Draw the Trend Line
Recall from Lesson 7 that the trend line for the sales data
we
have been plotting
is
given by the equation
Y
= 148.225 + 8.4087 * X
108
 Loading...