Lesson
#8
Plot Your Data
In this Lesson you will learn how to create graphs on the Liquid Crystal Display
(LCD).
Experiment
#1
Graphics
The purpose
of
the Plot Your Data program, which will be presented shortly, is to
read a list
of
quarterly sales figures and display them on the LCD. To do this requires
the ability to display both graphics and text characters.
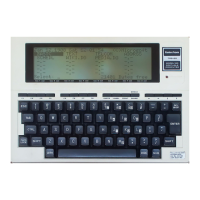
The LCD display on your Model
100 consists
of
240 X 64 individual cells which can
be used to display both graphics and text characters. The following series
of
simple
keyboard commands will serve to illustrate this.
Clear the screen
by
entering the following command:
CLS
then turn on the cell in the center
of
the display with the command:
PSET (120,32)
Turn on the cells in each
of
the four corners
of
the display with:
CLS
(ENTER)
PSET (0,0) : PSET (0,63)
(ENTER)
PSET (239,0) : PSET (239,63)
(EJrnID
The cells are quite small, so you will have to look carefully to see the illuminated
"dots."
You have probably figured out that the first number in the parentheses
determines the horizontal (X) axis position on the display, and the second number
determines the vertical (Y) axis position.
Since the corners are the extreme points of the LCD display, the range
of
X values is
o(left side)
to
239 (right side), and the range of Y values
is
0 (top) to
63
(bottom).
You should experiment a little with the PSET command
by
turning on various cells on
the
LCD display.
You can erase graphic cells in a similar way. To
see
this more clearly, clear the LCD
and turn on a few cells
in
the middle
of
the display:
CLS
(ENTER)
PSET(120,32):PSET(121,33):PSET(119,33)
(ENTER)
Now turn off a cell using the
PRESET
command:
PRESET(120,32)
(ENTERJ
Try turning off the remaining two cells. Experiment with turning cells on and off until
you feel comfortable addressing cells in any position on the display.
99
 Loading...

