System Overview
R&S
®
ZVA
50Getting Started 1145.1090.62 ─ 13
3.2 Screen Elements
This section describes the operating concept of the network analyzer, including the
alternative navigation tools for mouse and hardkey operation, the trace settings, mark-
ers and diagram areas. For a description of the different quantities measured by the
analyzer refer to chapter 3.3, "Measured Quantities", on page 75.
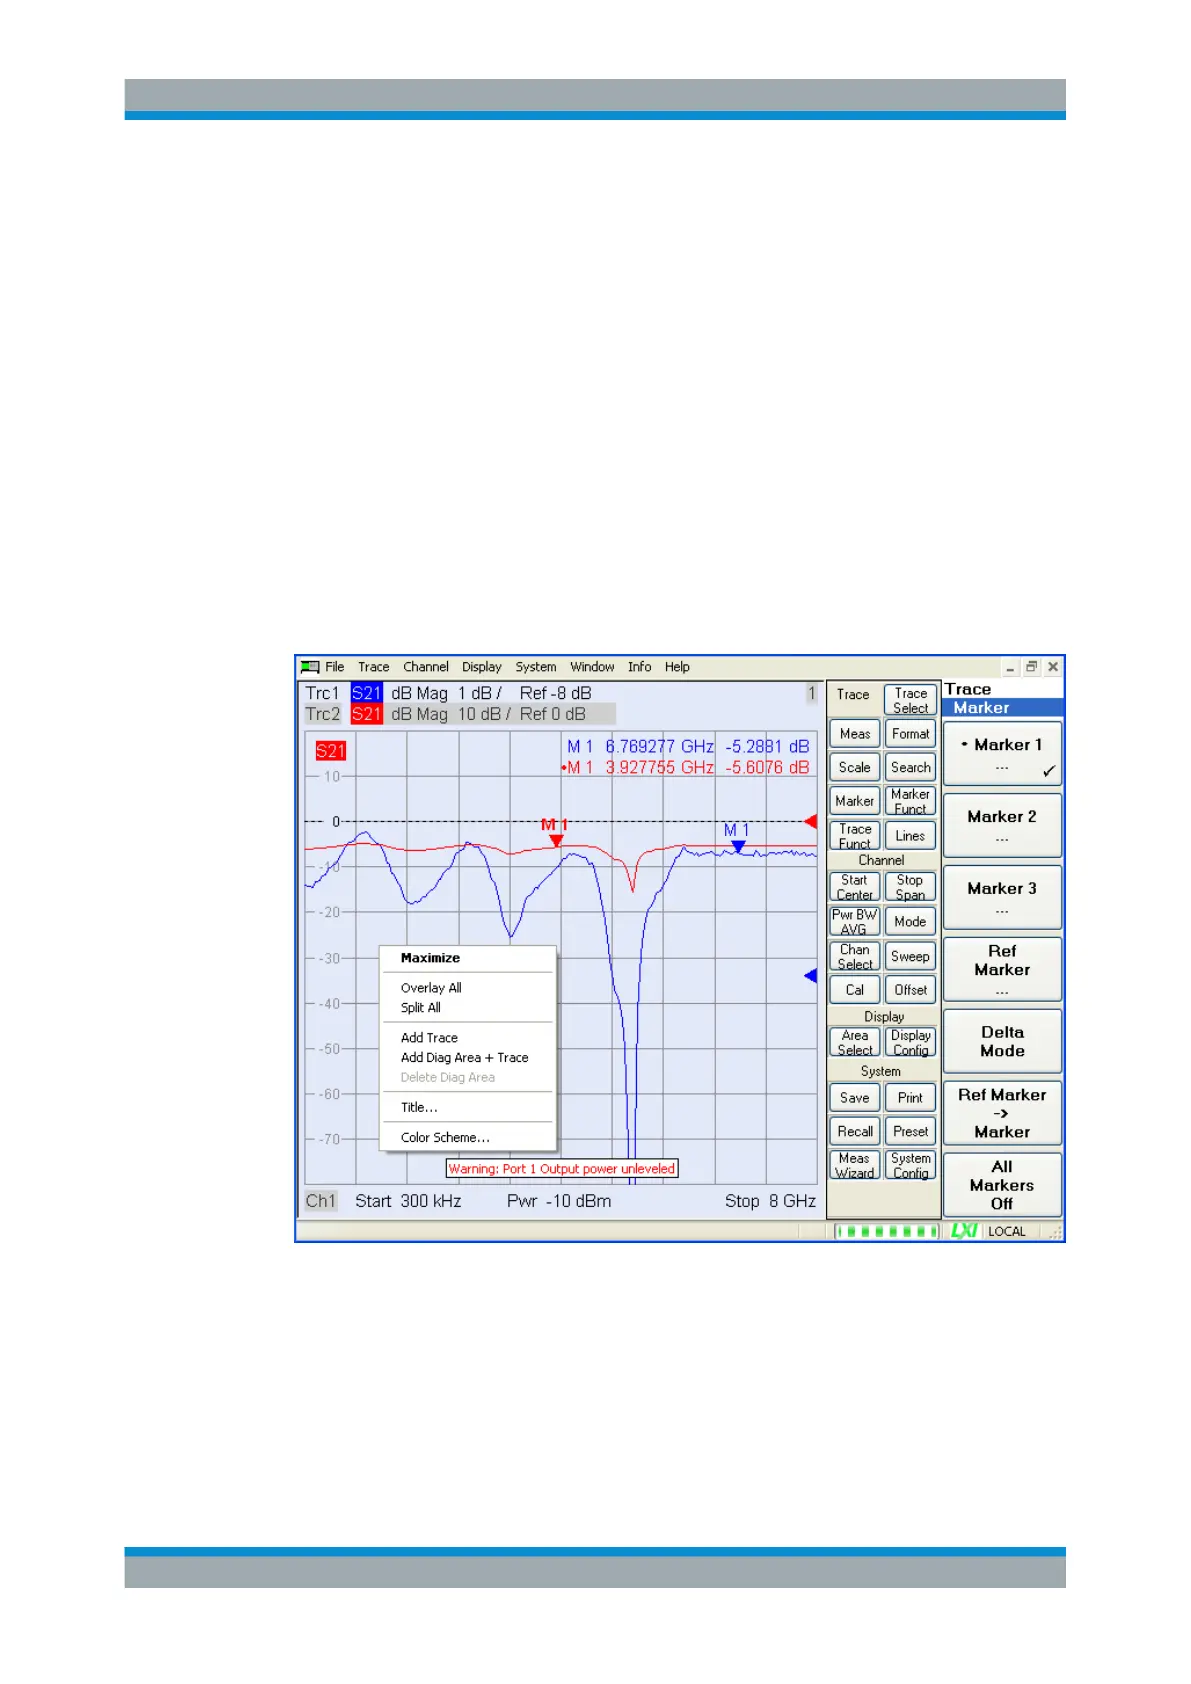
3.2.1 Navigation Tools of the Screen
The main window of the analyzer provides all control elements for the measurements
and contains the diagram areas for the results. There are several alternative ways to
access an instrument function:
●
Using the menus and submenus of the menu bar (provides all settings)
●
Using the softkeys of the softkey bar (alternative to the previous method)
●
Using the hardkey bar (preselection of the most important menus)
For further reference:
●
Refer to chapter 3.2.2, "Display Elements in the Diagram Area", on page 55 to
obtain information about the results in the diagram area.
●
Refer to section "Display Menu" in the reference chapter of your analyzer's Help
system and learn how to customize the screen.
Screen Elements

 Loading...


