System Overview
R&S
®
ZVA
70Getting Started 1145.1090.62 ─ 13
Examples for definite magnitudes and phase angles:
●
The magnitude of the reflection coefficient of an open circuit (Z = infinity, I = 0) is
one, its phase is zero.
●
The magnitude of the reflection coefficient of a short circuit (Z = 0, U = 0) is one, its
phase is –180 deg.
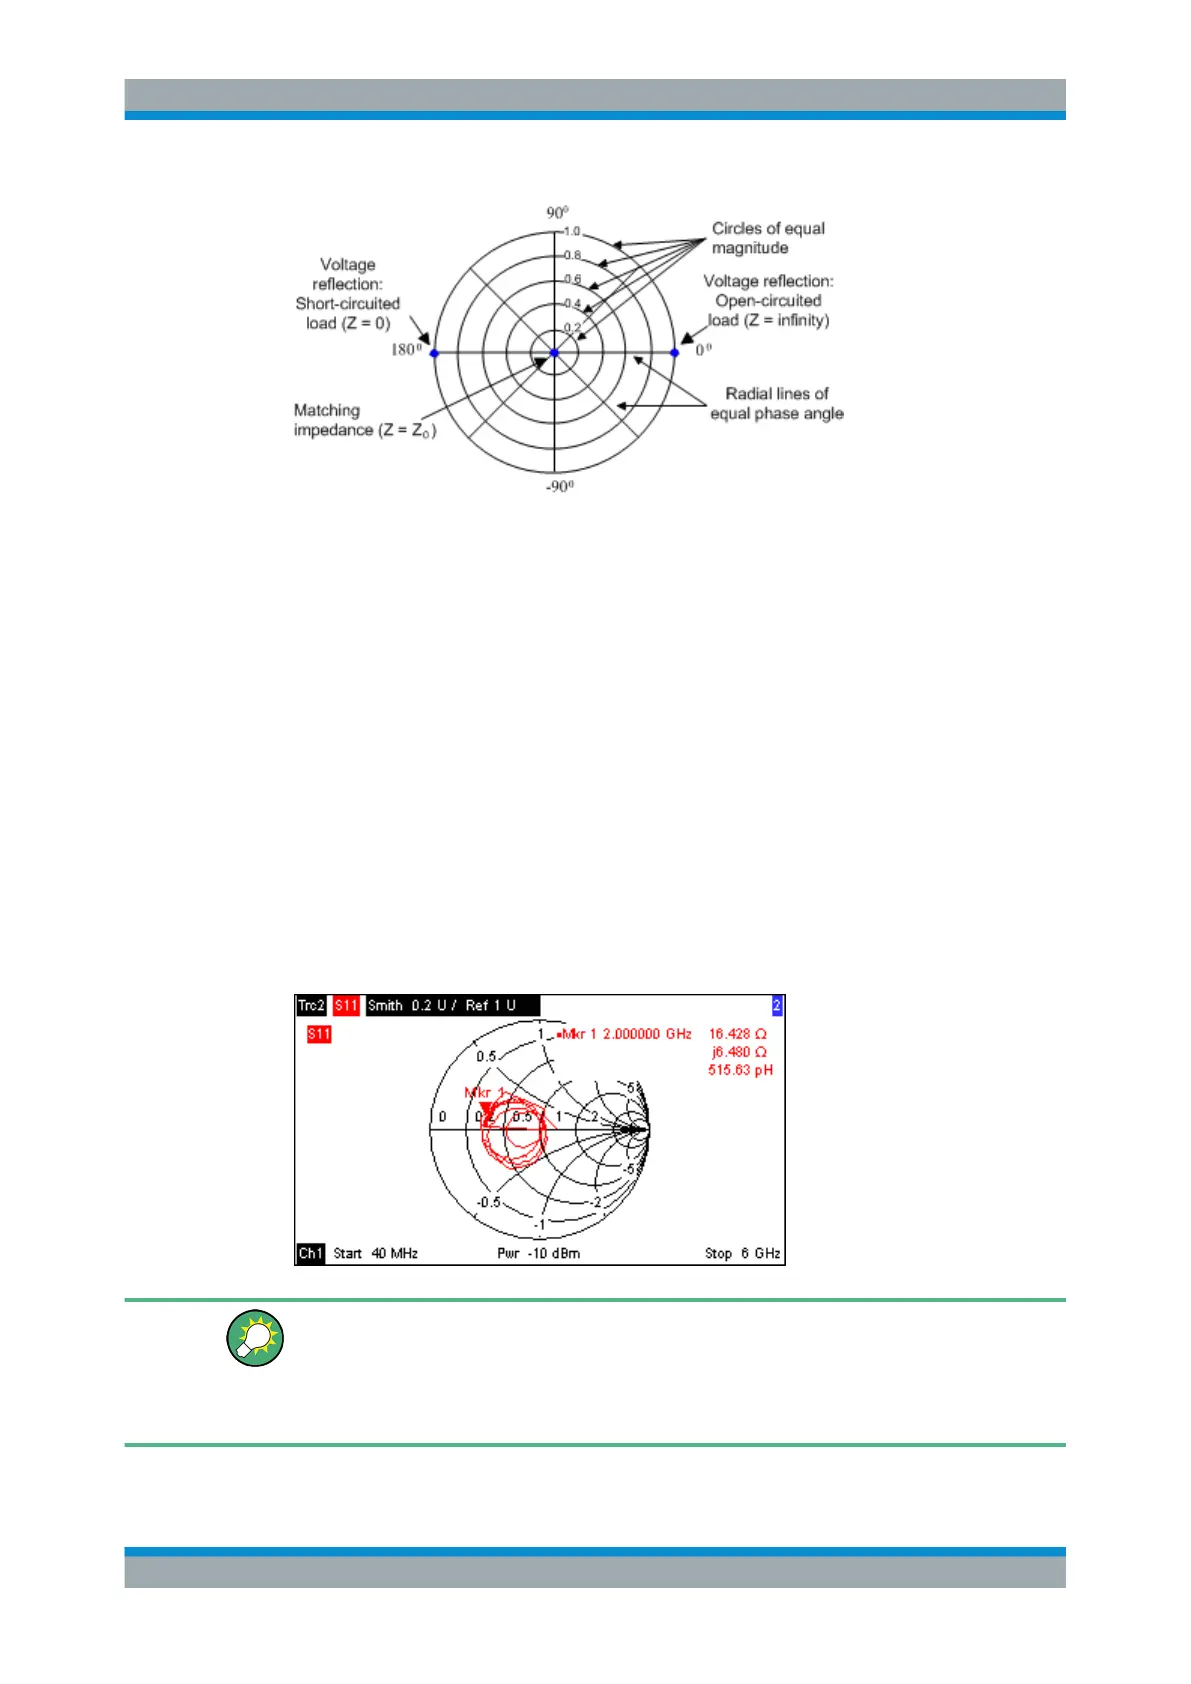
3.2.4.4 Smith Chart
The Smith chart is a circular diagram that maps the complex reflection coefficients S
ii
to normalized impedance values. In contrast to the polar diagram, the scaling of the
diagram is not linear. The grid lines correspond to points of constant resistance and
reactance.
●
Points with the same resistance are located on circles.
●
Points with the same reactance produce arcs.
The following example shows a Smith chart with a marker used to display the stimulus
value, the complex impedance Z = R + j X and the equivalent inductance L.
A comparison of the Smith chart, the inverted Smith chart and the polar diagram
reveals many similarities between the two representations. In fact the shape of a trace
does not change at all if the display format is switched from "Polar" to "Smith" or "Inver-
ted Smith" – the analyzer simply replaces the underlying grid and the default marker
format.
Screen Elements

 Loading...


