System Overview
R&S
®
ZVA
72Getting Started 1145.1090.62 ─ 13
According to the two equations above, the graphical representation in a Smith chart
has the following properties:
●
Real reflection coefficients are mapped to real impedances (resistances).
●
The center of the Γ plane (Γ = 0) is mapped to the reference impedance Z
0
,
whereas the circle with |Γ| = 1 is mapped to the imaginary axis of the Z plane.
●
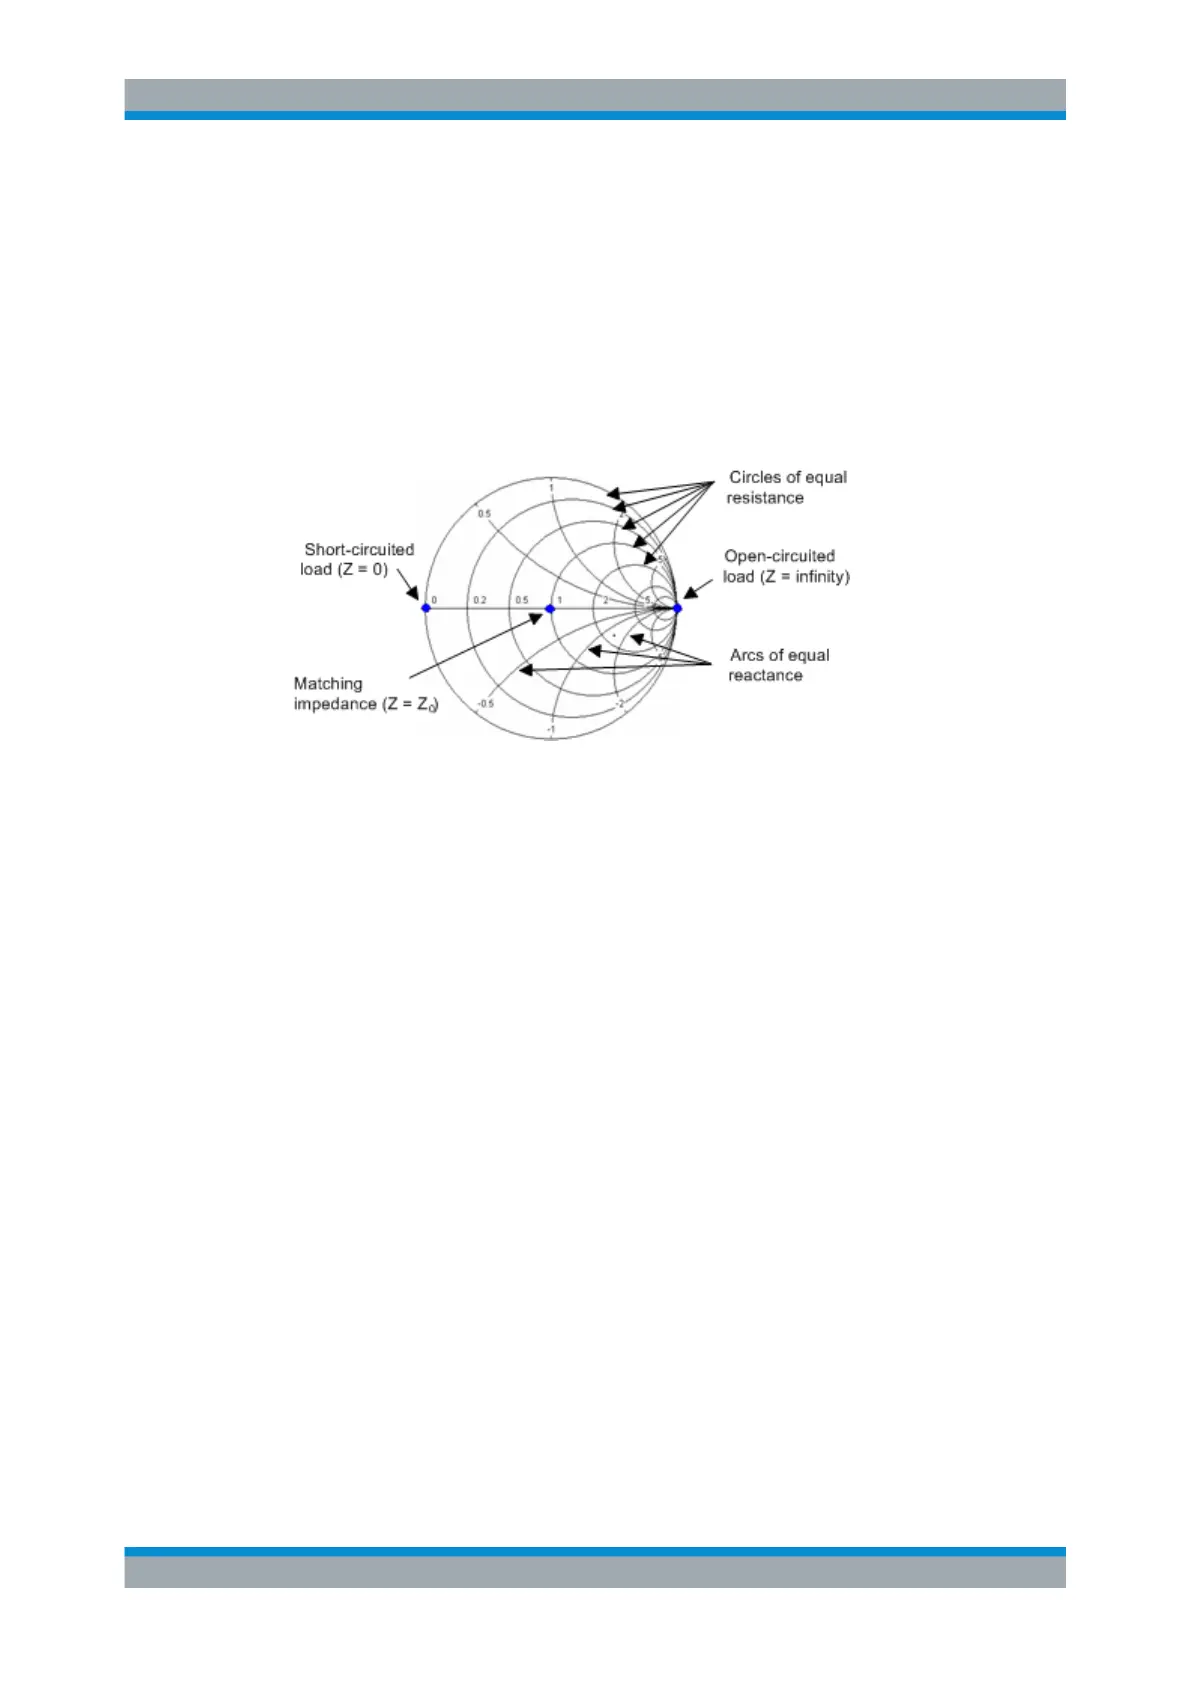
The circles for the points of equal resistance are centered on the real axis and
intersect at Z = infinity. The arcs for the points of equal reactance also belong to
circles intersecting at Z = infinity (open circuit point (1, 0)), centered on a straight
vertical line.
Examples for special points in the Smith chart:
●
The magnitude of the reflection coefficient of an open circuit (Z = infinity, I = 0) is
one, its phase is zero.
●
The magnitude of the reflection coefficient of a short circuit (Z = 0, U = 0) is one, its
phase is –180 deg.
3.2.4.5 Inverted Smith Chart
The inverted Smith chart is a circular diagram that maps the complex reflection coeffi-
cients S"ii" to normalized admittance values. In contrast to the polar diagram, the scal-
ing of the diagram is not linear. The grid lines correspond to points of constant conduc-
tance and susceptance.
●
Points with the same conductance are located on circles.
●
Points with the same susceptance produce arcs.
The following example shows an inverted Smith chart with a marker used to display the
stimulus value, the complex admittance Y = G + j B and the equivalent inductance L.
Screen Elements

 Loading...


