INTEGRA/-S/-G/-GS User Manual WEB GUI
SAF Tehnika JSC
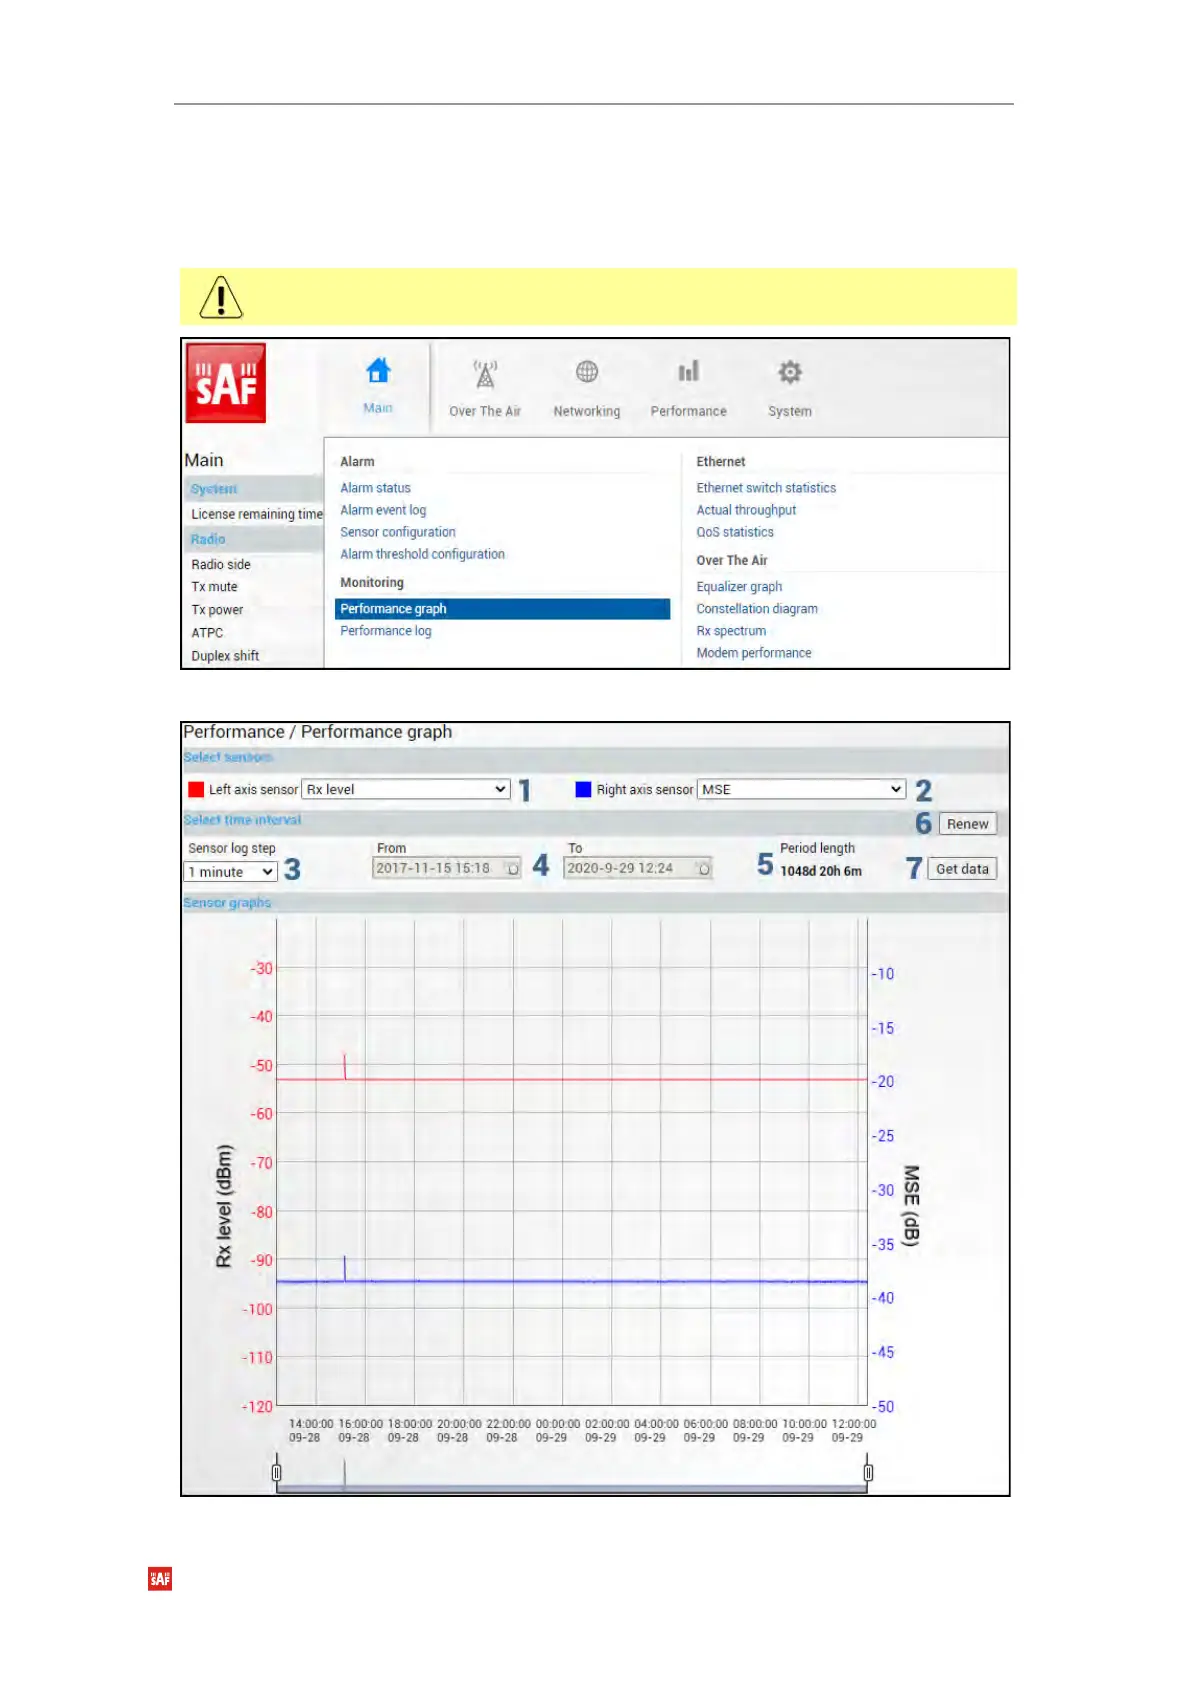
Performance → Monitoring → Performance graph
The Performance graph allows visualizing various parameters over a chosen time period as
curves. Available parameters will depend on the Sensor Configuration. Any two parameters
can be shown at a time. By default Rx level (dBm) and MSE (dB) are selected.
Not all sensors available in Sensor Configuration can be displayed in the Performance
graph.
MODIFY button is deactivated in the Performance graph page.