130
Appendix
SP 500 / 750-15 / 750-18 / 1000 / 1250 Operation Manual
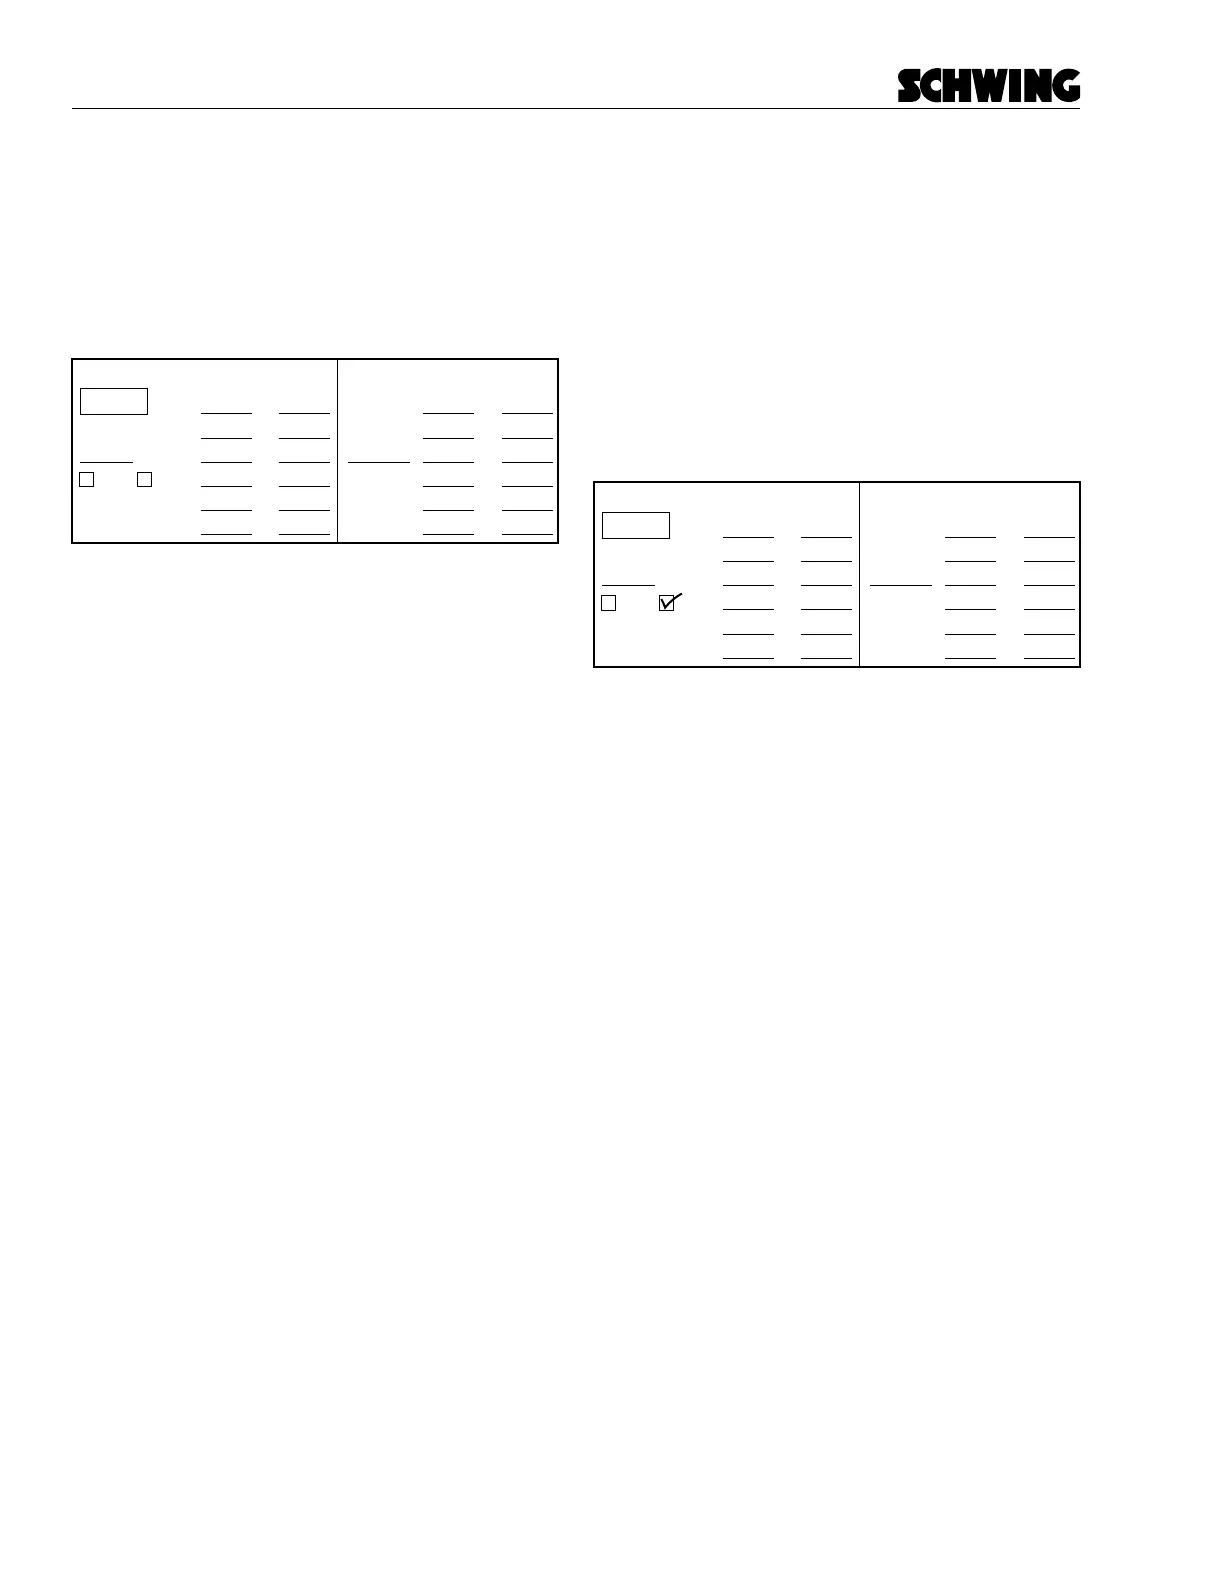
Example 2—Checking your hydraulic pumps
To determine whether your pumps are still in good
working condition, use the output chart and a ow me-
ter. Test one pump at a time, multiply the readings by
2, and chart the result. You must multiply the readings
because the chart is based on the output of two pumps,
but we are only testing one at a time.
Liters/min
(read on meter)
Total
(for plotting)
0 bar
100 bar
breakpoint
150 or 200 bar
250 bar
300 bar
x 2
x 2
x 2
x 2
x 2
x 2
Liters/min
(read on meter)
Total
(for plotting)
x 2
x 2
x 2
x 2
x 2
x 2
1st Pump 2nd Pump
Breakpoint
specification
breakpoint
Check output form-fill2
To test your pumps:
• Be sure you are using the chart that applies to
your unit.
• Select the proper gear for pumping (found on the
information plate mounted in the cab).
• Set the pump speed (input drive shaft) RPM.
Pump speed information is found on line 16 of
the Delivery Inspection Report, which arrived with
your unit when it was new. A dierence of even a
few RPM will give you a bad reading. Check the
RPM of the drive shaft with a digital tachometer if
one is available.
• Know how to use your owmeter. Read the in-
structions that came with it, and remember that a
owmeter must be calibrated periodically.
• Make two copies of the output chart so you don’t
ruin your original. You need one chart for each
pump tested.
Read the ow at 0 bar, 100 bar, 150 or 200 bar, 250
bar, and 300 bar. Also, document the breakpoint. The
breakpoint is where the ow drops o rapidly. You will
be able to notice it on the owmeter. If you think it would
be helpful, copy the chart below. Check which reading
you used (150 or 200 bar). The breakpoint will be very
close to either 150 or 200 bar, so it is not necessary
to take both readings. The breakpoint specication is
shown on each output chart.
As an example, we’ll assume that we have just taken
the following readings:
Liters/min
(read on meter)
Total
(for plotting)
0 bar
100 bar
breakpoint
150 or 200 bar
250 bar
300 bar
x 2
x 2
x 2
x 2
x 2
x 2
Liters/min
(read on meter)
Total
(for plotting)
x 2
x 2
x 2
x 2
x 2
x 2
1st Pump 2nd Pump
Breakpoint
specification
breakpoint
199
196
194
169
138
117
178
398
392
388
338
276
234
178