131
Appendix
SP 500 / 750-15 / 750-18 / 1000 / 1250 Operation Manual
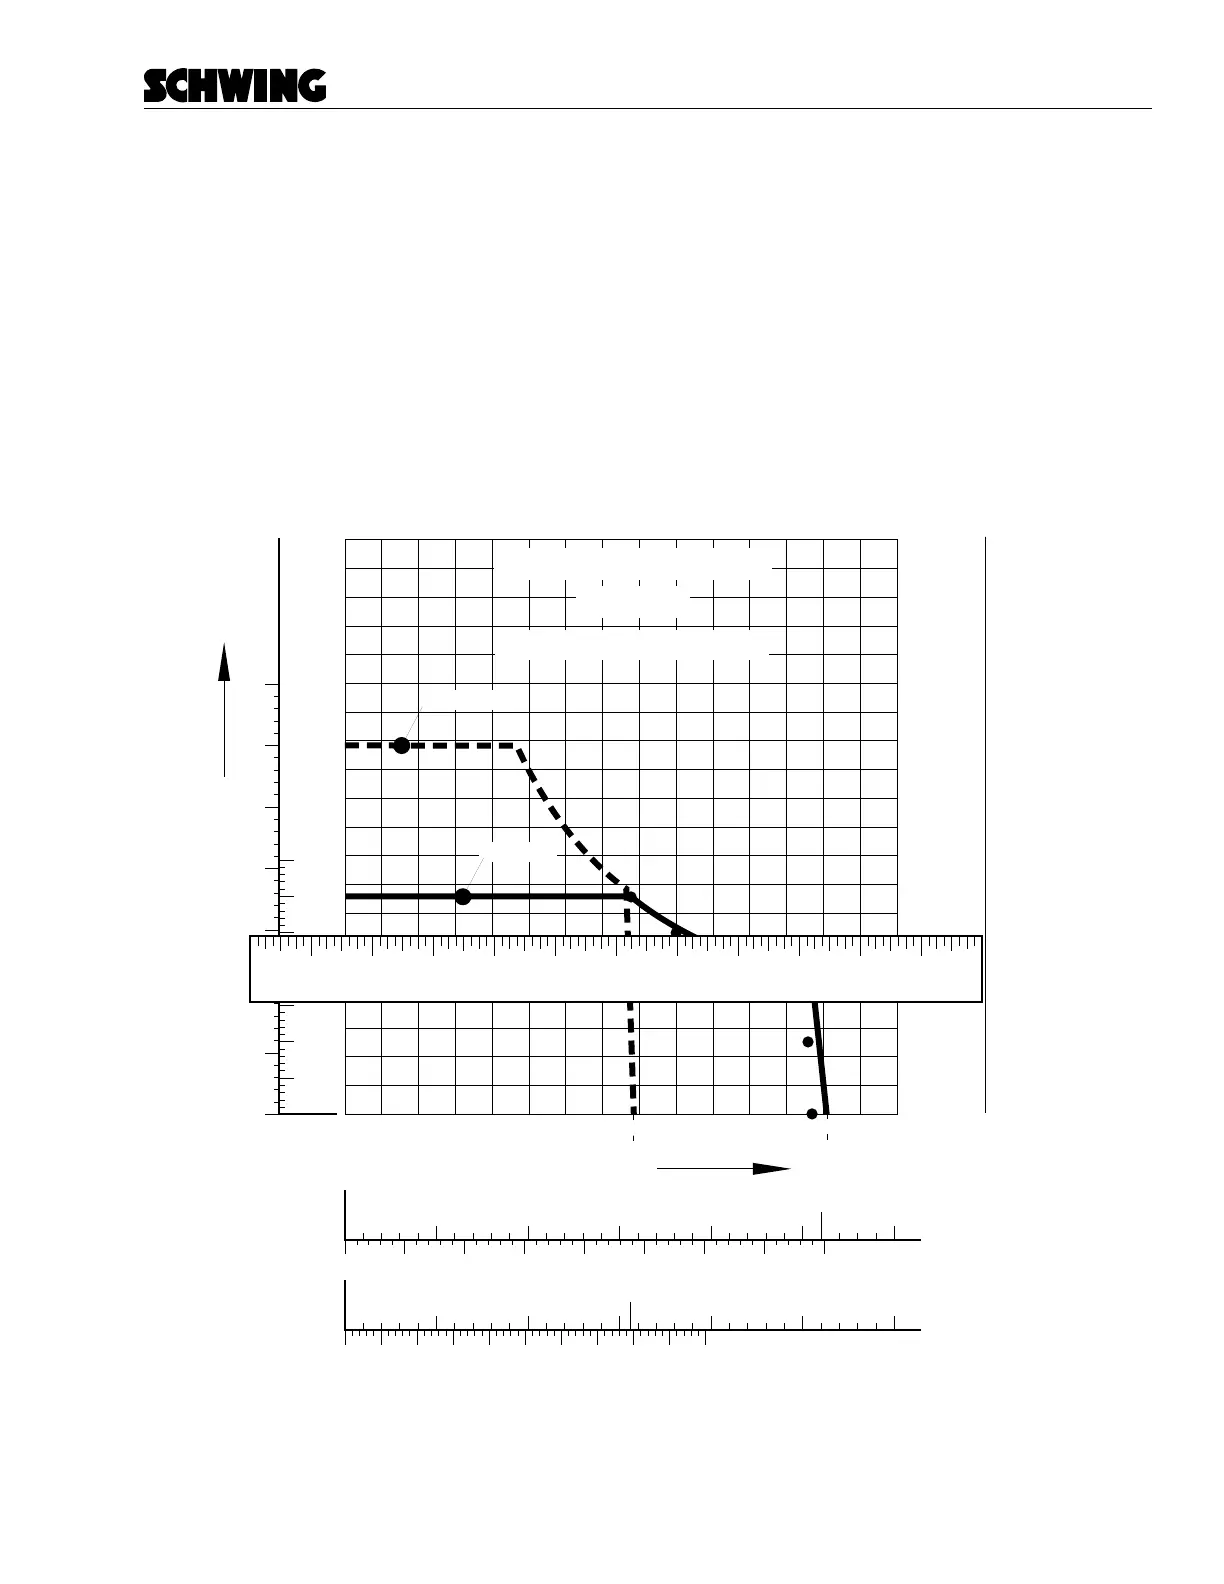
• Lay a straight edge horizontally across the
page at the pressure point you are plotting. Draw a
light line across the chart. In the example below,
we use the rod side scales and curve (you could
use the piston side scale and curve instead if you
were congured on the piston side). The ruler is
shown ready to draw a line at 250 bar hydraulic
pressure.
• Turn the ruler sideways, and draw a light line up
the page from the liters/minute reading you took
at that pressure (remember to multiply the reading
by 2). In our example, we measured 276 liters at
250 bar.
• Put a dot at the point where the two lines inter-
sect.
Do the same thing with each pressure reading. You
should end up with six dots.
13
CONCRETE OUTPUT (cu yd / h)
NUMBER OF STROKES
(stroke / min.)
OIL VOLUME
(liter / min.)
NUMBER OF STROKES
(stroke / min.)
OIL VOLUME
(liter / min.)
26 39 52 65 78 92 105 118 131 1440
103
157 170 183
ROD SIDE
HYDRAULIC RELIEF VALVE IS SET AT
300 BAR MAX. PRESSURE (4350 PSI).
PUMP SPEED
2100 RPM
PERFORMANCE CHARACTERISTICS OF
THE AXIAL PISTON HYDRAULIC PUMP
PISTON SIDE
PISTON
SIDE
ROD
SIDE
100 200 300 400
350
100 200 300 40050 150 250
500
510152025
51015202530
15.5
PISTON SIDE
(bar)
ROD SIDE
(bar)
CONCRETE
PRESSURE
(BAR)
7
14
21
28
34
41
48
55
62
70
76
83
90
97
103
110
117
124
131
138
CONCRETE
PRESSURE
(PSI)
100
200
300
400
500
600
700
800
900
1000
1100
1200
1300
1400
1500
1600
1700
1800
1900
2000
1285 88.6
52758
350
50
100
150
200
250
300
50
100
150
200
250
300
350
OIL PRESSURE (BAR)
30
196
170.5
26
breakpoint
178 bar
12345678910 11
1checking output.eps