8015886/Z713/2016-10-10 •
Subject to change without notice
•
SICK AG
•
Waldkirch
•
Germany
•
www.sick.com
TiM55x/TiM56x/TiM57x | S i C K
Step
a.
Installing and launching the SOPAS configura
-
tion software
The SOPAS configuration software is usedasstandard to
display the surrounding contour (measuring line) recorded
by the TiM, as well as diagnostic information in the event of
an error.
1.
DownloadandinstallonthePCthesoftwarefromthe
website “
www.sick.com/SOPAS_ET
“, software type SOPAS
ET.In thiscase, selectthe "Complete" optionas selected
bytheinstallation wizard. Administratorrightsmay be
required on the PC to install the software.
2.
Start the "
SOPAS
"program option after completing the
installation.
Path:
Start > Programs > SICK > SOPAS Engineering Tool
>
SOPAS.
3.
Establish communication between SOPAS and TiM via the
wizard
t
hat
has s
t
ar
t
ed automaticall
y:
Select
C
onne
C
t t
o
a
new deviCe.
4.
Follow the steps in the Connection Wizard until the
F
ound
deviCes window.
5.
Select the appropriate TiM from the list of available
devices:
•
Use TiM on port 2111 to configure the device.
•
Use TiM on port 2112 to view only measurement data.
Default IP address of the TiM:
6.
Assign the required IPaddress/subnet mask to theTiM
via automatiCally or manually. The IP address/subnet
mask should correspond to the address space of the later
application.
7.
Click Finish to quit the Connection Wizard.
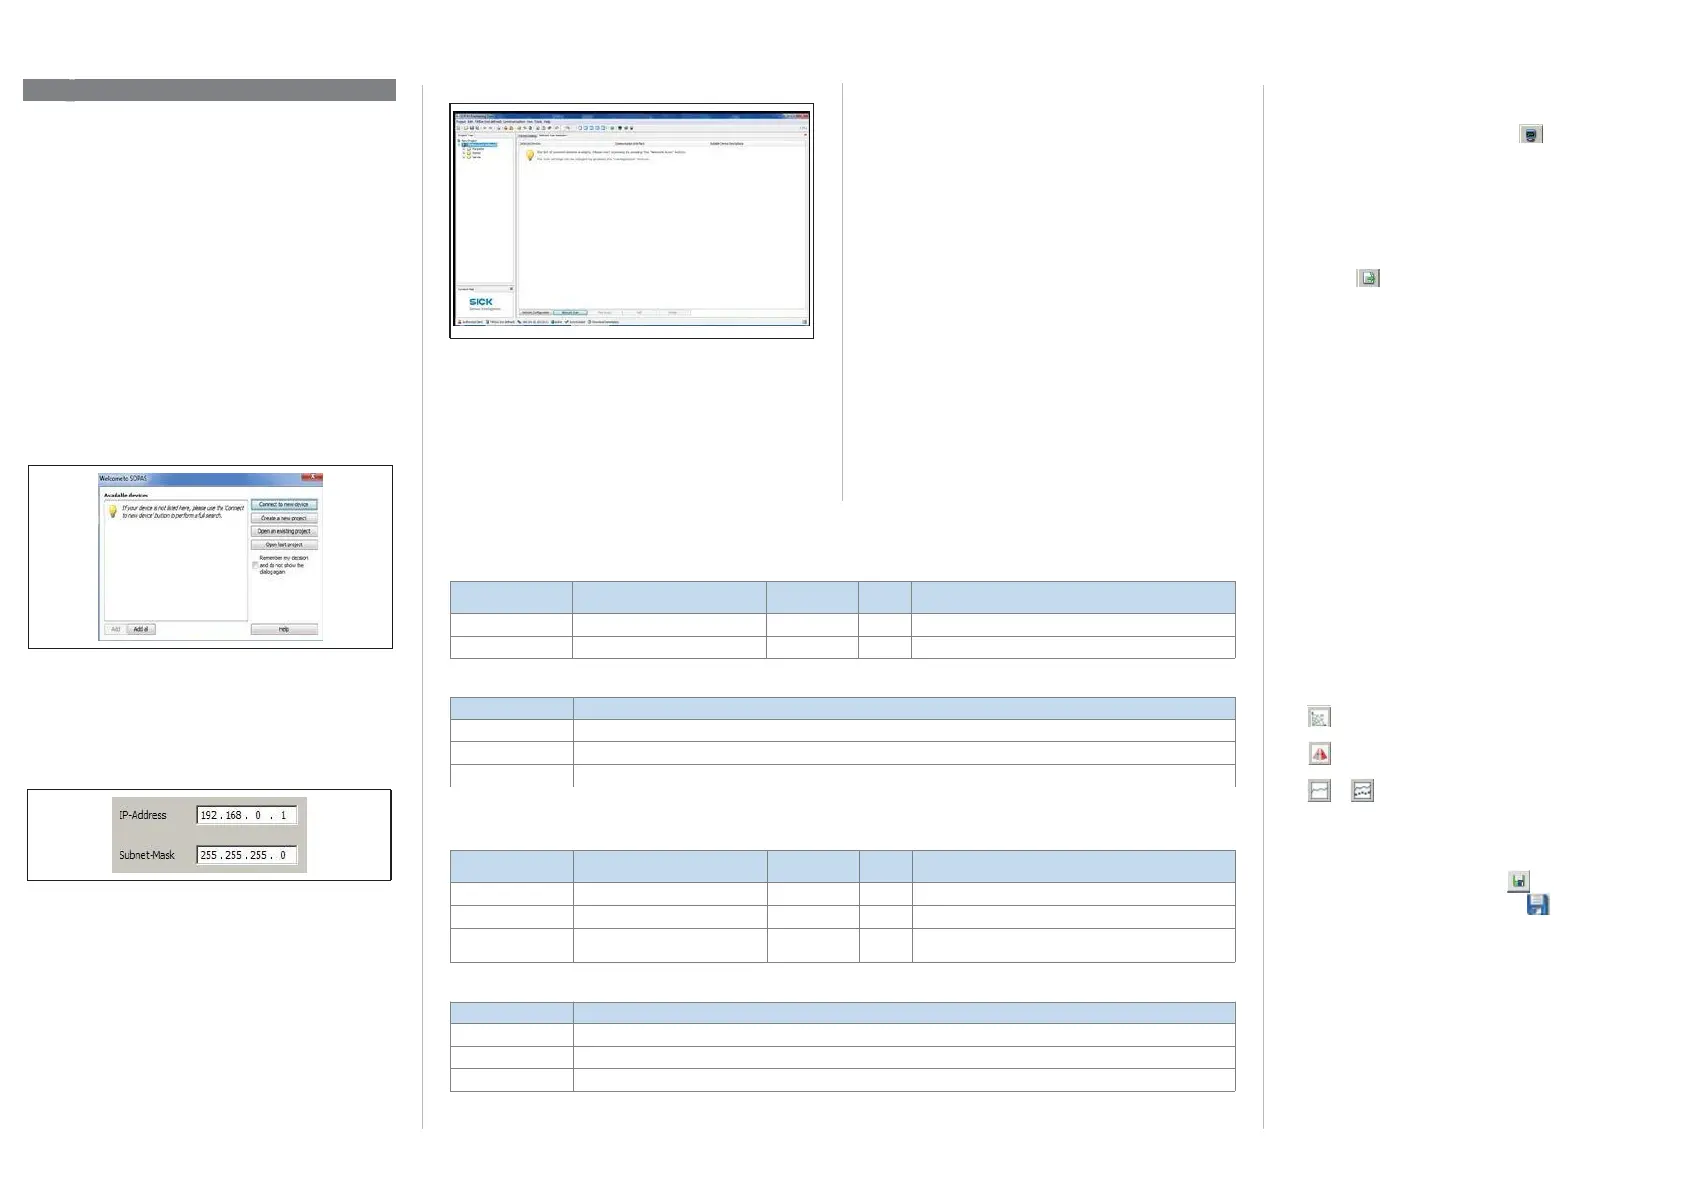
SOPAS ET establishes communication with the TiM, loads
its current device description (parameters), and displays it
in the navigation tree.
SOPAS ET program window for TiM
Navigation tree (left) and respective device pages (right)
One-off output of measuredvalues:
Telegram layout: sRN LMDscandata
Example:
Continuous output of measured values:
Telegram structure: sEN LMDscandata measurement start/stop
Example:
b. Output of measuredvalues
If
t
he
T
iM
r
eceiv
es
one
of
t
he
two
follo
wing
commands
b
y t
ele
-
gram over the Ethernet or USB interface it will start the output
of measured values in real time over these data interfaces.
The detailed construction of the output telegram as well
as the flow of requests and outputs is described in the
"
Measured value output
“ in the
Technical Information
(Nr. 8015883).
Activatethe output ofthemeasured values in SOPAS on a
trial basis:
1.
Start the terminal emulator with the
button.
2.
Select
t
he
C
onne
C
t
...
comm and
in
t
he
C
onne
C
tions
menu
in the dialog window and establish communication with
the TiM over the Ethernet or USB interface.
3.
Enteroneofthe twotelegrams inthe"Send telegram"
input line as they appear (automatically framed by STX and
ETX when sending in the default setting). Pay attention to
blank characters in the string.
4.
Use the
button totransferthe telegram to the TiM.
The TiM respondsbyproviding the data asaone-offor
continuously in the display area of the terminalemulator.
Data output format of the measured values
The data output format per scan is comprised of the
measured values (radial distance, RSSI), device and status
information and time stamp.
In the default settings, the distance is output as a measured
value (in mm).
Inorderto outputremission values in the telegram, selectthe
Rssi checkbox.
Todisplay the remission values in the scan as well, select the
Rssi... checkbox.
Output range of the measured values
TheTiMscans an angle range of 270°(-45°to 225°) and
outputs 271 measured values per scan in the default setting.
The angle range forwhich measured values can be output
can be set via
o
utput RanGe
(TiM55x: resolution 1°, TiM56x:
resolution 0.33°).
Some other useful functions
•
button: Display the fields in the polar coordinate
system
•
button: Change the view of the TiM from above (TiM:
black) to the view from below (TiM: blue)
•
or
button:
Switc
h
of
f t
he
displa
y t
he
full
measur
-
ing line or display a dotted measuring line.
Completing the configuration
>
Permanently save the entire configuration:
Parameter set in: TiM click the
button
Configuration fileonthe PC:click the
button.
Commissioning/Configuration
Request (SOPAS read by name)
<STX>sRN{SPC}LMDscandata<ETX>
02 73 52 4E 20 4C 4D 44 73 63 61 6E 64 61 74 61 03
02 02 02 02 00 00 00 0F 73 52 4E 20 4C 4D 44 73 63 61 6E 64 61 74 61 05
Request (SOPAS event by name)
0 Stop measured value output
1 Start measured value output
<STX>sEN{SPC}LMDscandata{SPC}1<ETX>
02 73 45 4E 20 4C 4D 44 73 63 61 6E 64 61 74 61 20 31 03
02 02 02 02 00 00 00 11 73 45 4E 20 4C 4D 44 73 63 61 6E 64 61 74 61 20 01 33
 Loading...