Engineering and remote access
3.6 SITOP UPS Manager
SITOP UPS1600 / UPS1100
Manual, 04.2017, A5E37775406-8-76
131
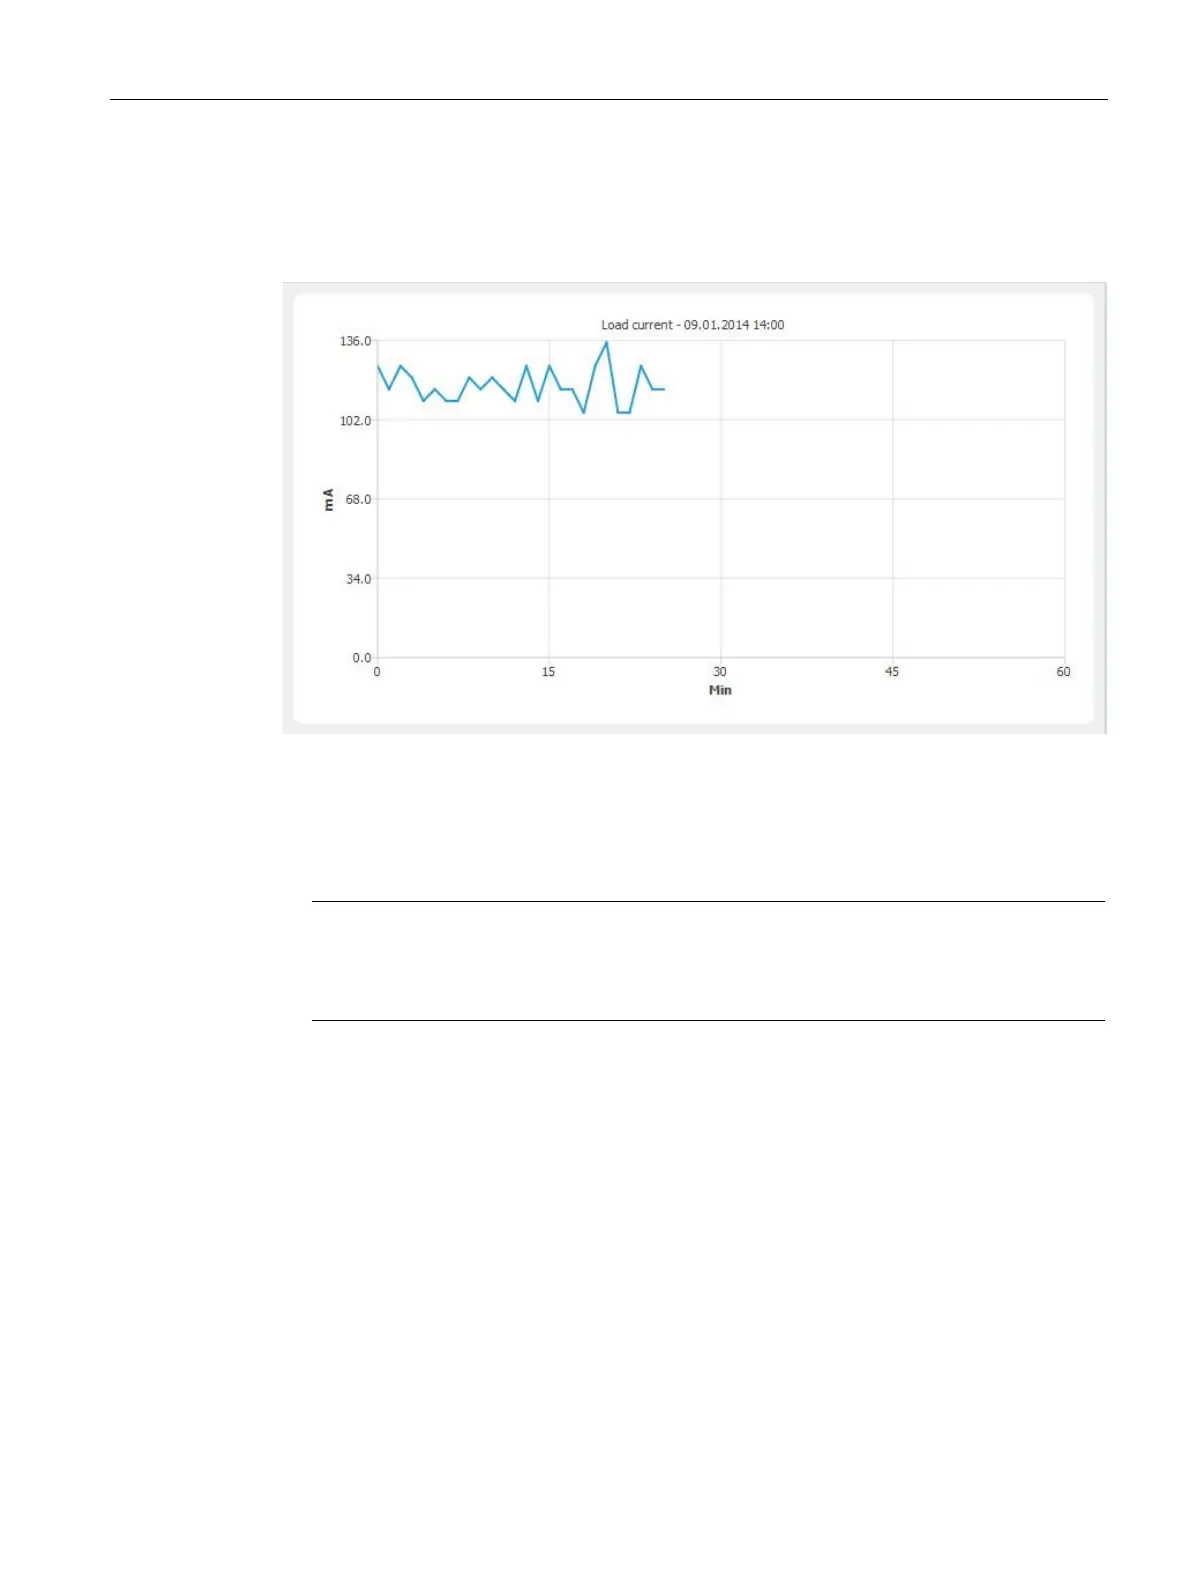
You have the possibility of graphically displaying values about the power supply under
"Display> Trend chart", for instance the load current over time:
The following trend charts can be selected:
● Load current over time
● Input voltage over time
● Remaining buffer time
Note
From the instant in time when the SITOP
UPS1600 is switched over into the buffer mode,
o determine the expected buffer time, instead of the expected buffer current, the actually
measured buffer current is used.
● Battery temperature over time
● Battery charge over time
● Charge current over time
 Loading...