Siemens Building Technologies CE2B5324xx 08.08.2017 9
Only fit one compartment for the power supply. Do not
remove the red locking hatch.
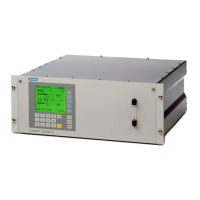
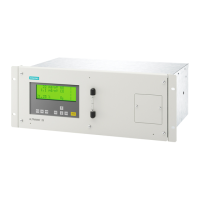
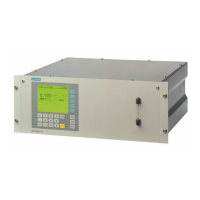
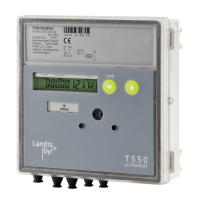
3. Operating
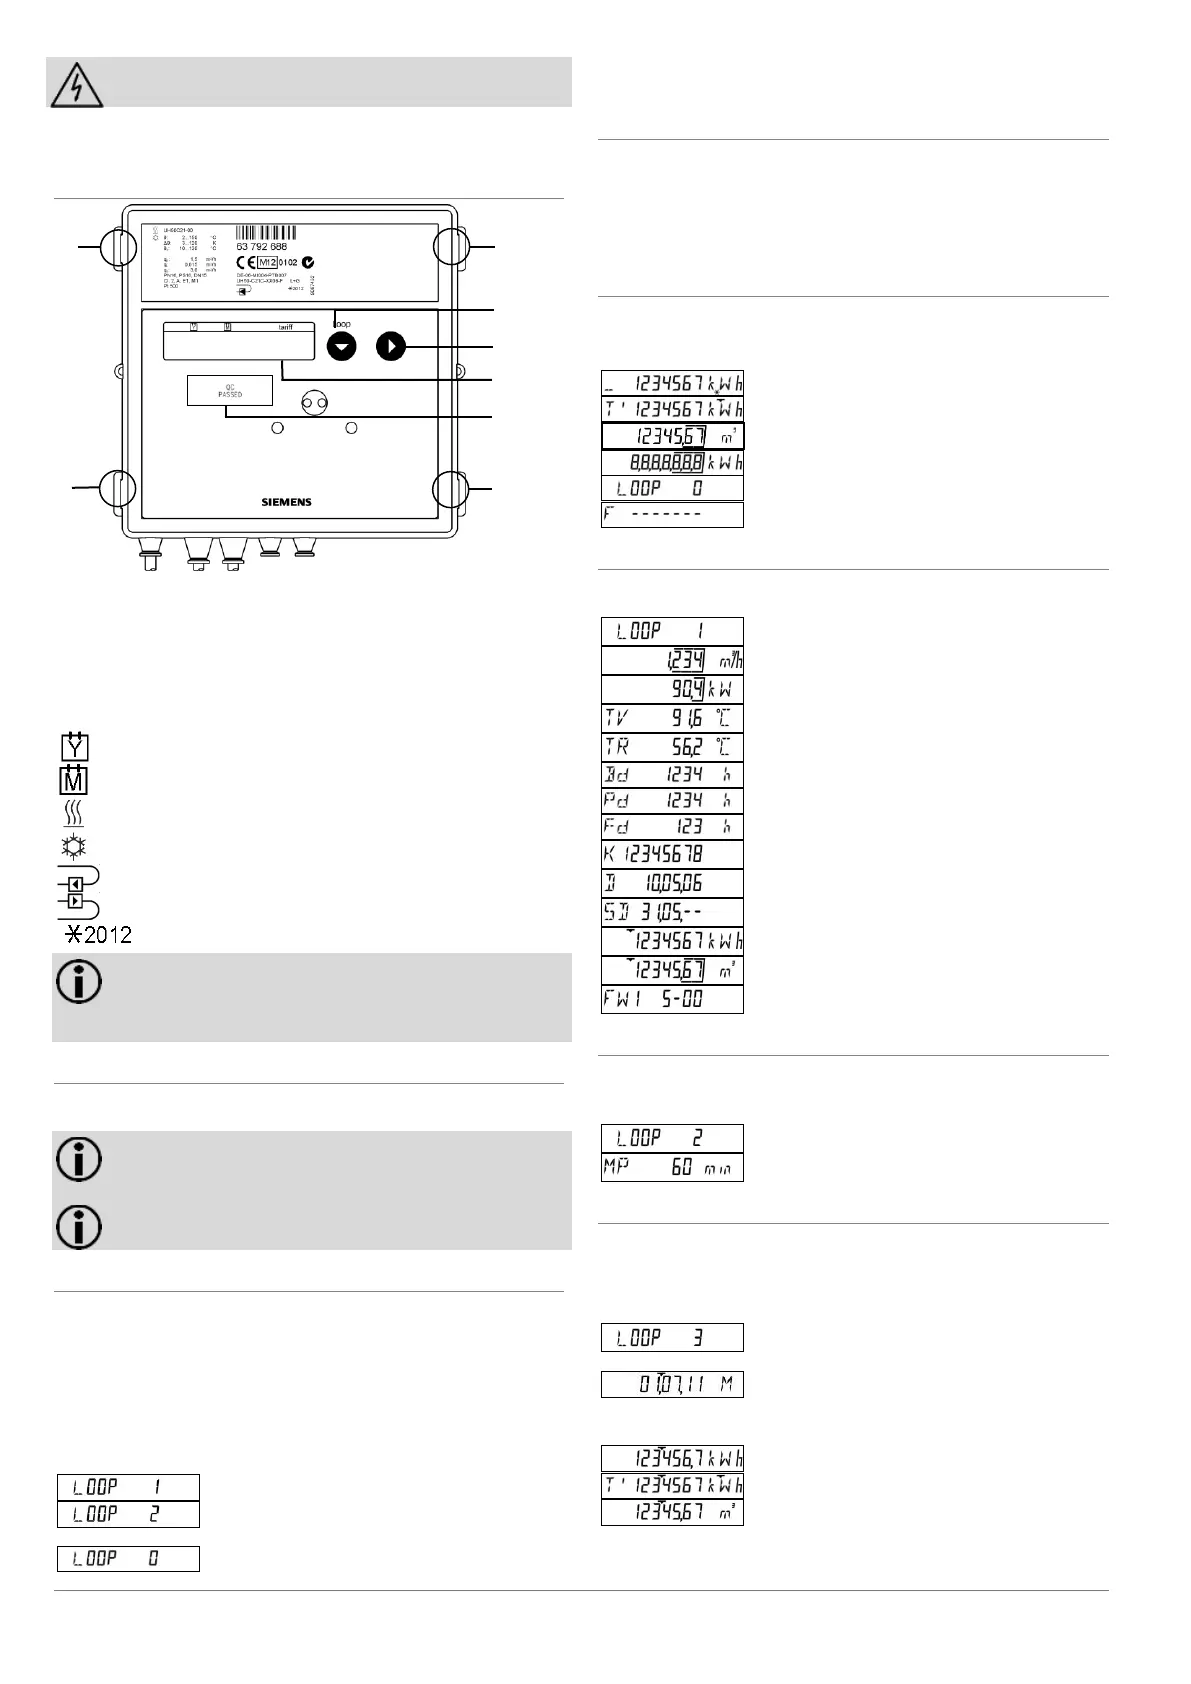
3.1 Operating elements
Identification: Previous year's value (set day value)
Identification: Previous month's value
Installation site: Return-flow
Note: Both display range and data displayed can differ
from the description depending on the appliance pa-
rameterisation. Certain button functions can also be
blocked.
3.2 Displaying current meter status
The meter displays the current meter status in kWh, MWh, MJ
or GJ.
Note: In order to prevent reading errors, the decimal
places of the values displayed are marked with a
frame.
Note: Calibrated values can be recognised by an
additionally displayed star symbol.
Display values
Switch to the service loops to display the values. Proceed as
follows:
To switch from the user loop into the service loops press
button 1.
The displays of the meter are arranged in several levels
(LOOPs).
To switch the LCDs between the loops press button 1.
The LCD shows the following values one after the other:
After the last loop is displayed, the user loop “LOOP 0” comes
up again.
Switching in a loop
Proceed as follows to switch to the next display value within a
loop:
Press button 2.
The first display value will appear again after the final display
value.
User loop “LOOP 0“
The meter is located in the user loop “LOOP 0“.
To switch to the next display value press button 2.
The LCD displays the following values one after the other:
Energy accumulated with tariff status
Tariff register 1 (optional)
In case of error: message with error code
Service loop 1 “LOOP 1“
Service loop 1 displays the details of the current measurement.
The LCD shows the following values one after the other:
TV current temperature hot side,
TR current temperature cold side;
in 2-sec. cycles
Property number, 8-stellig
Energy: previous year on set day
Volume: previous year on set day
Service loop 2 “LOOP 2“
Service loop 2 displays the measurement period for establish-
ing the maximum.
The LCD shows the following values one after the other:
Measurement period for establishing the maximum
Service loop 3 “LOOP 3“
Service loop 3 displays the monthly values.
In order to display the monthly values, press button 2.
The set day of the current month is displayed.
To select the desired month, press button 1.
To request the associated values, press button 2.
The LCD displays the following values one after the other:
Tariff register 1 on the set day
 Loading...