12
also have defined allowable noise (undesirable sound energy) level exposure
limits for persons in industrial environments. Selected and applicable parts of
those currently in force are cited in this manual. Standards and government
regulatory laws are subject to modification or expansion. Check for the latest
available documents and information.
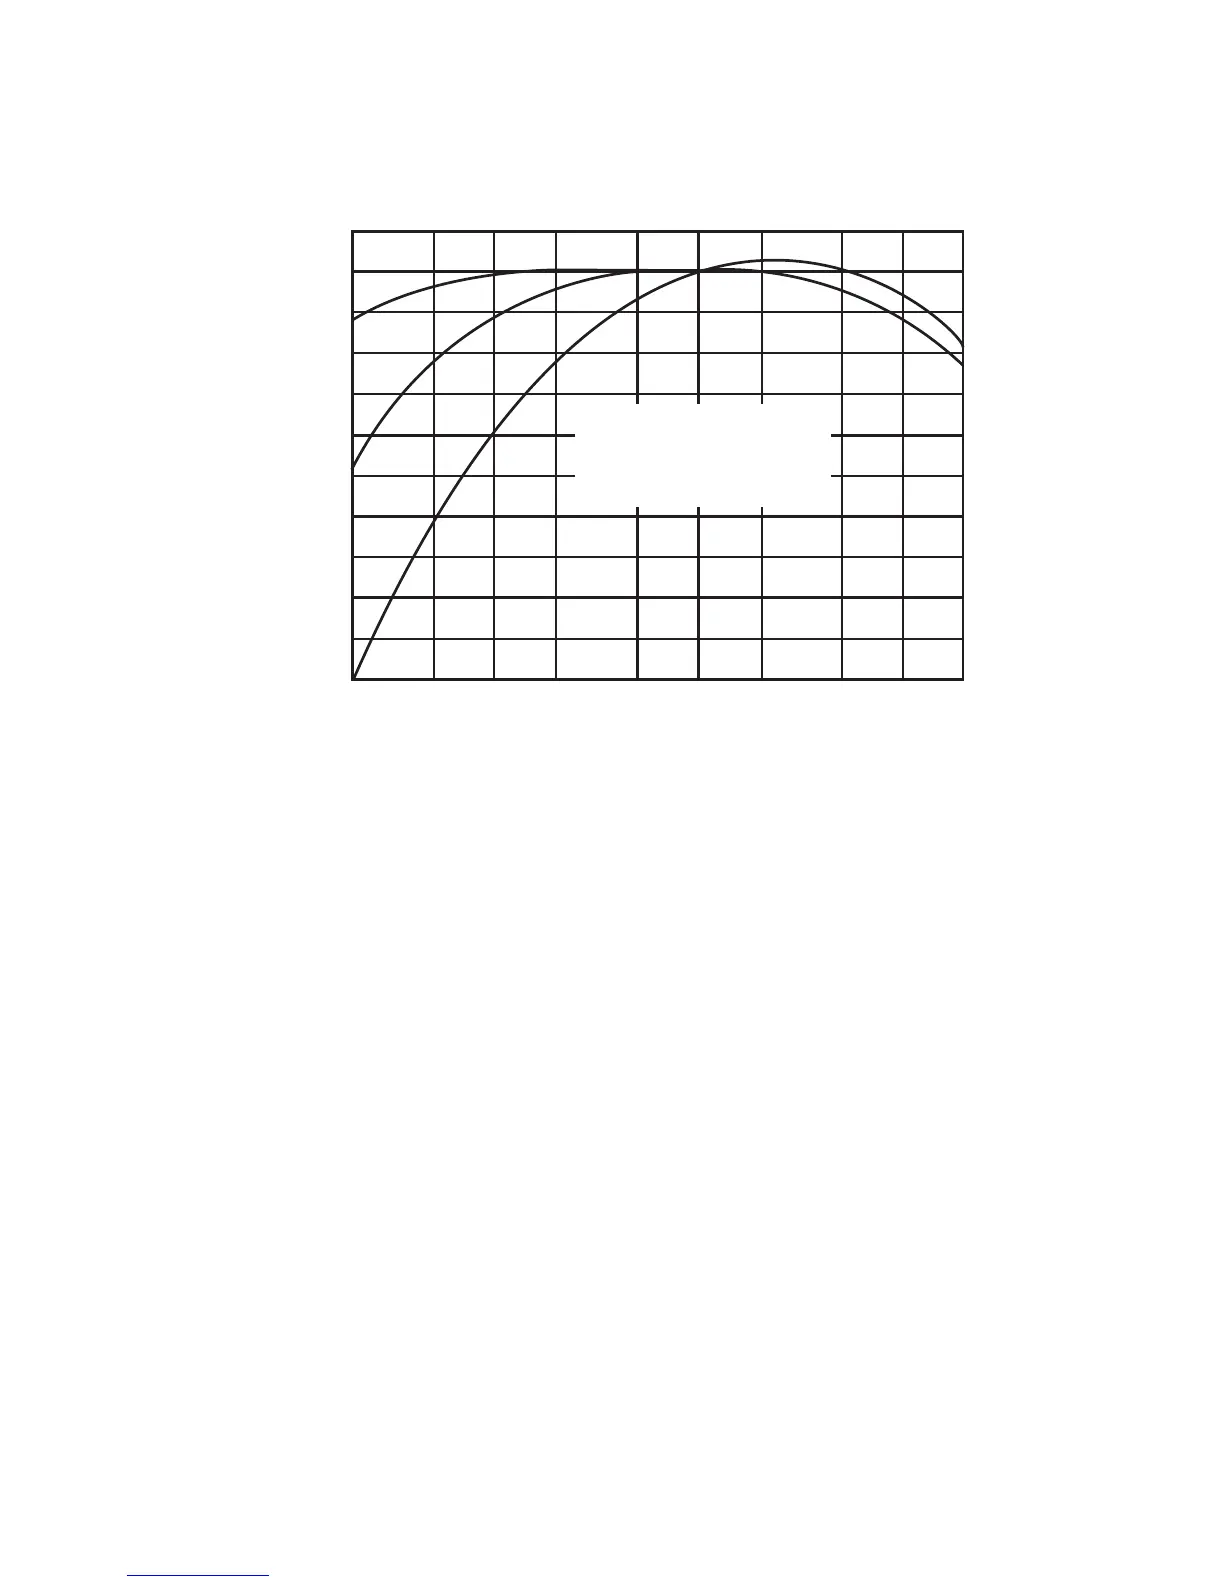
The specification for a Type 2 instrument takes into account the average re-
sponse of the human ear which varies as a function of the intensity of sound. It
grounds intensity into three weighting curves; “A”, “B” and “C”. The “A” weighted
curve more closely corresponds to the human ear at the low sound levels.
As indicated in Figure 3-1, the “B” and “C” weighting curves include more of the
low frequency information. Thus, at any level, measurements taken with various
weightings can be compared in determining the frequency content of the noise.
This is done by indicating the level dB, accompanied by the weighting letter
notation “A”, “B” or “C”, preferable in parenthesis; e.g., the 100 dB (A), etc.
The allowable employee noise level exposure limits are established by the Oc-
cupational Safety and Health Act of 1970 (OSHA), the Walsh-Healy Act (Federal
Register, Volume 34, No. 96) and paragraph 1910.95 of the Occupational Safety
and Health Standards (Federal Register, Vol. 36, No. 105, May 29, 1971) and the
OSHA Hearing Conservation Program Amendment, Federal-Register Vol 46, No.
162, August 21, 1981. Table 3-1 summarizes these limits.
0
–5
–10
–35
–30
–15
–20
–25
–40
–45
–50
+5
20 50 100
200
500
1000 2000
5000
10,000
20,000
FREQUENCY RESPONSES
FOR SLM WEIGHTING
CHARACTERISTICS
FREQUENCY (Hz)
RELATIVE RESPONSE DECIBELS
B AND C
A
C
B
A
Figure 3-1. A, B and C Weighted Responses of the Sound Level Meter