9 Operation
SMA Solar Technology AG
Operating manualSTP15-25TL-30-BE-en-1750
9 Operation
9.1 Display Overview
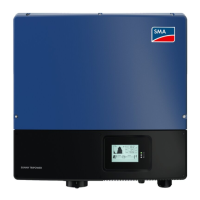
The display shows the current operating data of the inverter (e.g. current power, daily energy, total
energy) as well as events or errors. Power and energy are displayed as bars in a diagram.
Figure 8: Display overview (example)
Position Symbol Explanation
A - Current power
B - Energy on the current day
C - Total amount of energy fed in
D Active connection to a Speedwire network
Active connection to SunnyPortal
Multifunction relay is active
Power limitation due to excessive temperature
Active power limitation via PV system control
 Loading...
