Spectrum DSP M2 User Manual V1.1
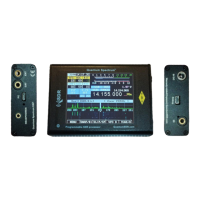
Main LCD Touch display
On the main display, just above the Spectrum Scope, there are a number of indicators:
• Main Frequency Display: This may be displayed either as a single frequency
(transmit/receive as in Figure 4) or as a “Split” display showing both frequencies with
separate transmit and receive frequencies. If the numbers in this display are grey the
“Frequency Lock” (configured in the menu) is active. If this display is yellow, a
transverter offset has been configured.
• RIT+Tuning Display: Above and to the right of the main frequency display is a smaller
display that is offset from the main display if the RIT is set to something other than
zero.
• Band Display: To the right of the main frequency display is an indicator of the
amateur band in which the current frequency is tuned with click areas underlined in red
and green to increment or decrement the band. If the current frequency is outside an
amateur band it will display “Gen” (e.g. “General Coverage”), depending on
configuration settings.
• Mode Indicator: Above the MHz digits of the main frequency display is the current
demodulation mode displayed on a blue background.
• Zones: These three zones are controlled via clicking the top box to toggle through the
P 8
Figure 4: The main screen (annotated) with the SPLIT function disactivated.
When “Frequency Translate” mode is on, the center frequency indicator will be
shifted right of center by 12 kHz to reduce the SDR noise level near DC zero.