49
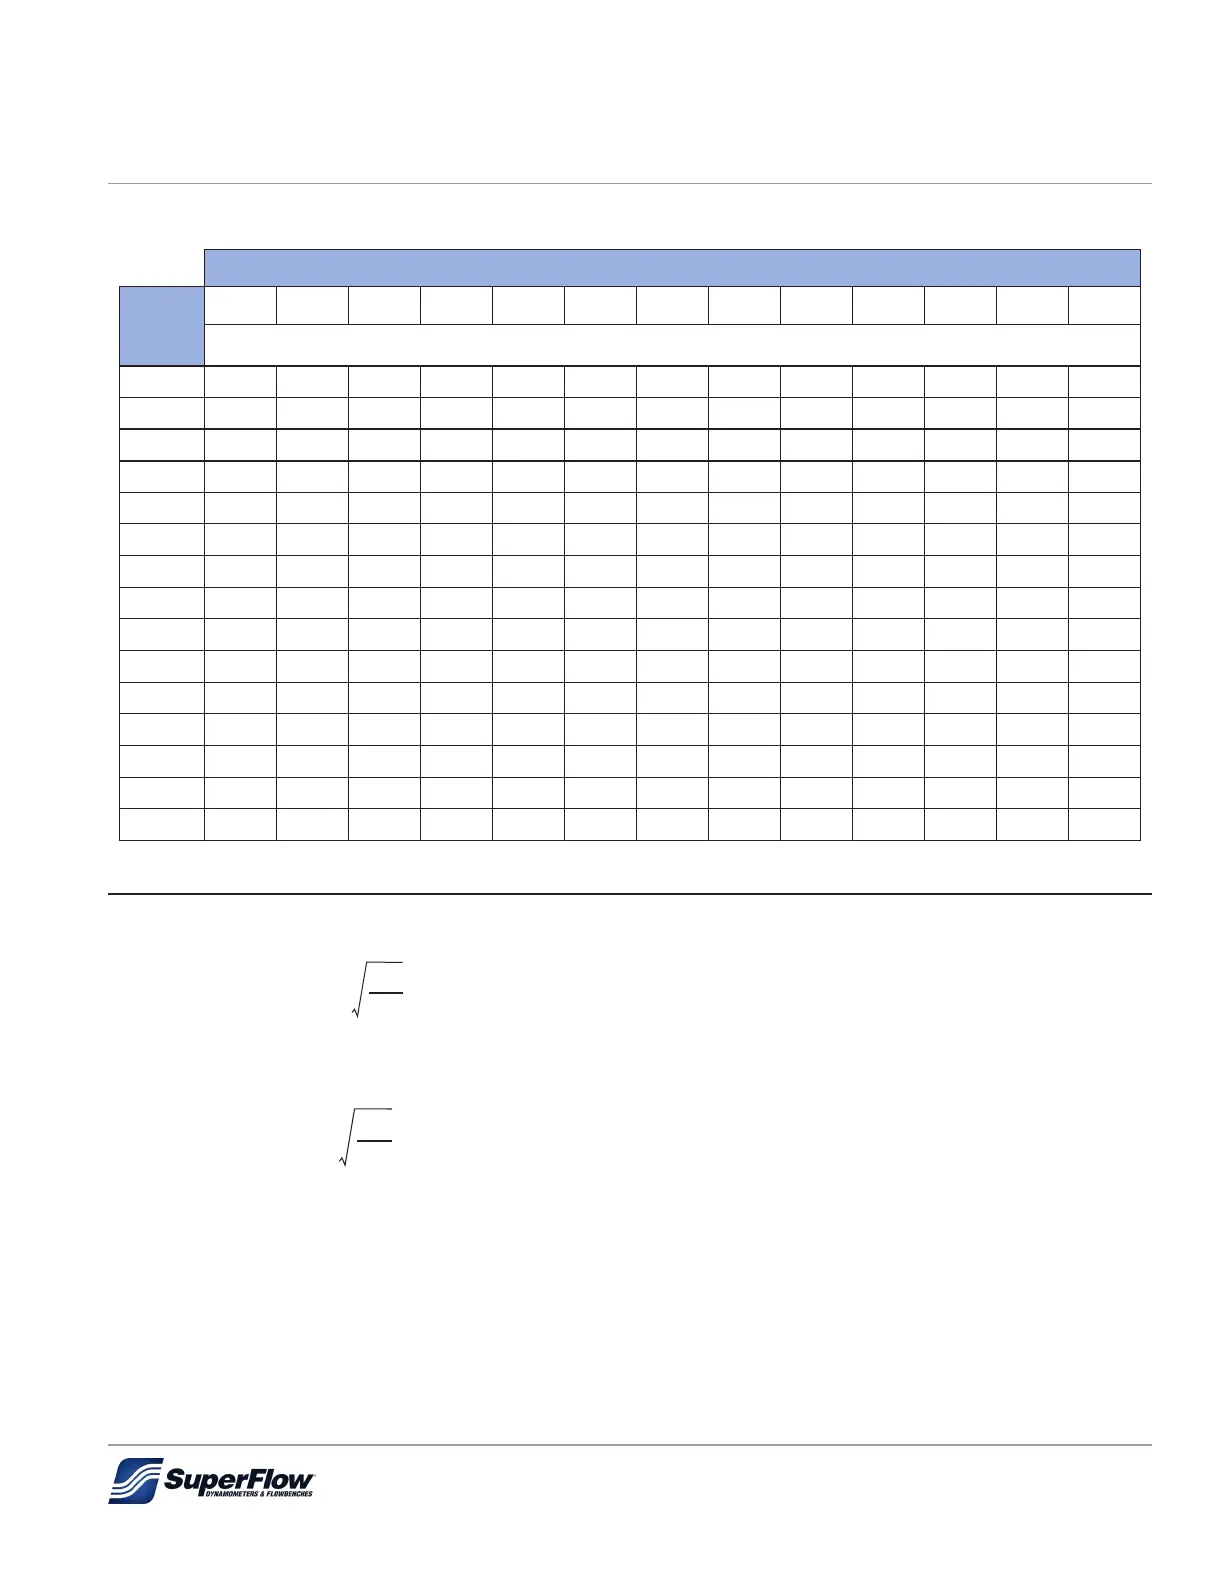
Table 7-1. Flowbench Test Pressure Conversion Chart
Want Flow At:
Have
Flow
At
3 5 7 10 12 15 20 25 28 30 35 40 45
3 1.000 1.290 1.530 1.820 2.000 2.240 2.580 2.890 3.050 3.160 3.420 3.650 3.870
5 0.774 1.000 1.180 1.410 1.550 1.730 2.000 2.240 2.370 2.450 2.650 2.830 3.000
7 0.655 0.845 1.000 1.120 1.310 1.460 1.690 1.890 2.000 2.070 2.240 2.390 2.540
10 0.548 0.707 0.387 1.000 1.090 1.220 1.410 1.580 1.670 1.730 1.870 2.000 2.120
12 0.500 0.645 0.764 0.913 1.000 1.120 1.290 1.440 1.530 1.580 1.710 1.830 1.940
15 0.447 0.577 0.683 0.816 0.894 1.000 1.150 1.290 1.370 1.410 1.530 1.630 1.730
20 0.387 0.500 0.592 0.707 0.774 0.866 1.000 1.120 1.180 1.220 1.320 1.410 1.500
25 0.346 0.447 0.529 0.632 0.693 0.775 0.894 1.000 1.060 1.100 1.180 1.260 1.340
28 0.327 0.422 0.500 0.598 0.654 0.721 0.845 0.945 1.000 1.040 1.120 1.200 1.270
30 0.316 0.408 0.483 0.577 0.632 0.707 0.816 0.913 0.966 1.000 1.080 1.150 1.220
35 0.293 0.378 0.447 0.535 0.586 0.655 0.756 0.845 0.894 0.926 1.000 1.070 1.130
40 0.274 0.354 0.418 0.500 0.548 0.612 0.707 0.791 0.837 0.866 0.935 1.000 1.060
45 0.258 0.333 0.394 0.471 0.516 0.577 0.667 0.745 0.789 0.816 0.882 0.943 1.000
50 0.245 0.316 0.374 0.424 0.490 0.547 0.633 0.707 0.749 0.774 0.837 0.895 0.949
60 0.224 0.289 0.341 0.387 0.447 0.499 0.578 0.645 0.684 0.707 0.764 0.817 0.866
Example 1:
If ow is 65 cfm at a test pressure of 5”, what would the ow be at 15”?
CFM = = 65 X 1.73 = 112.565 X
Example 2:
If ow is 42 l/s at a test pressure of 12 cm, what would ow be at 40 cm?
LS = = 42 X 1.83 = 76.5742 X
Flow at any test pressure will vary as the square root of the ratios of the two test pressures.
7.0 Flowbench Theory
 Loading...