QUALITY CONTROL
5-2 Sysmex KX-21 Operator’s Manual -- Revised October 1998
1.3 QC Chart Screen
When the QC program is executed, the QC Chart screen appears first. The QC Chart screen
displays a QC chart selected from six QC Files. Just after execution of the QC Chart
program, File No. 1 Control Chart appears. Its Menu Display Area displays "1: QC
Analyze," "2: Settings," and "3: Erase All." The menu can be executed using the numeric
keys.
The QC Chart can display QC data up to the latest 60 points. When a new data comes in, the
oldest data is erased.
The control parameters indicated in the QC Chart are CBC8 parameters displayed on three
pages.
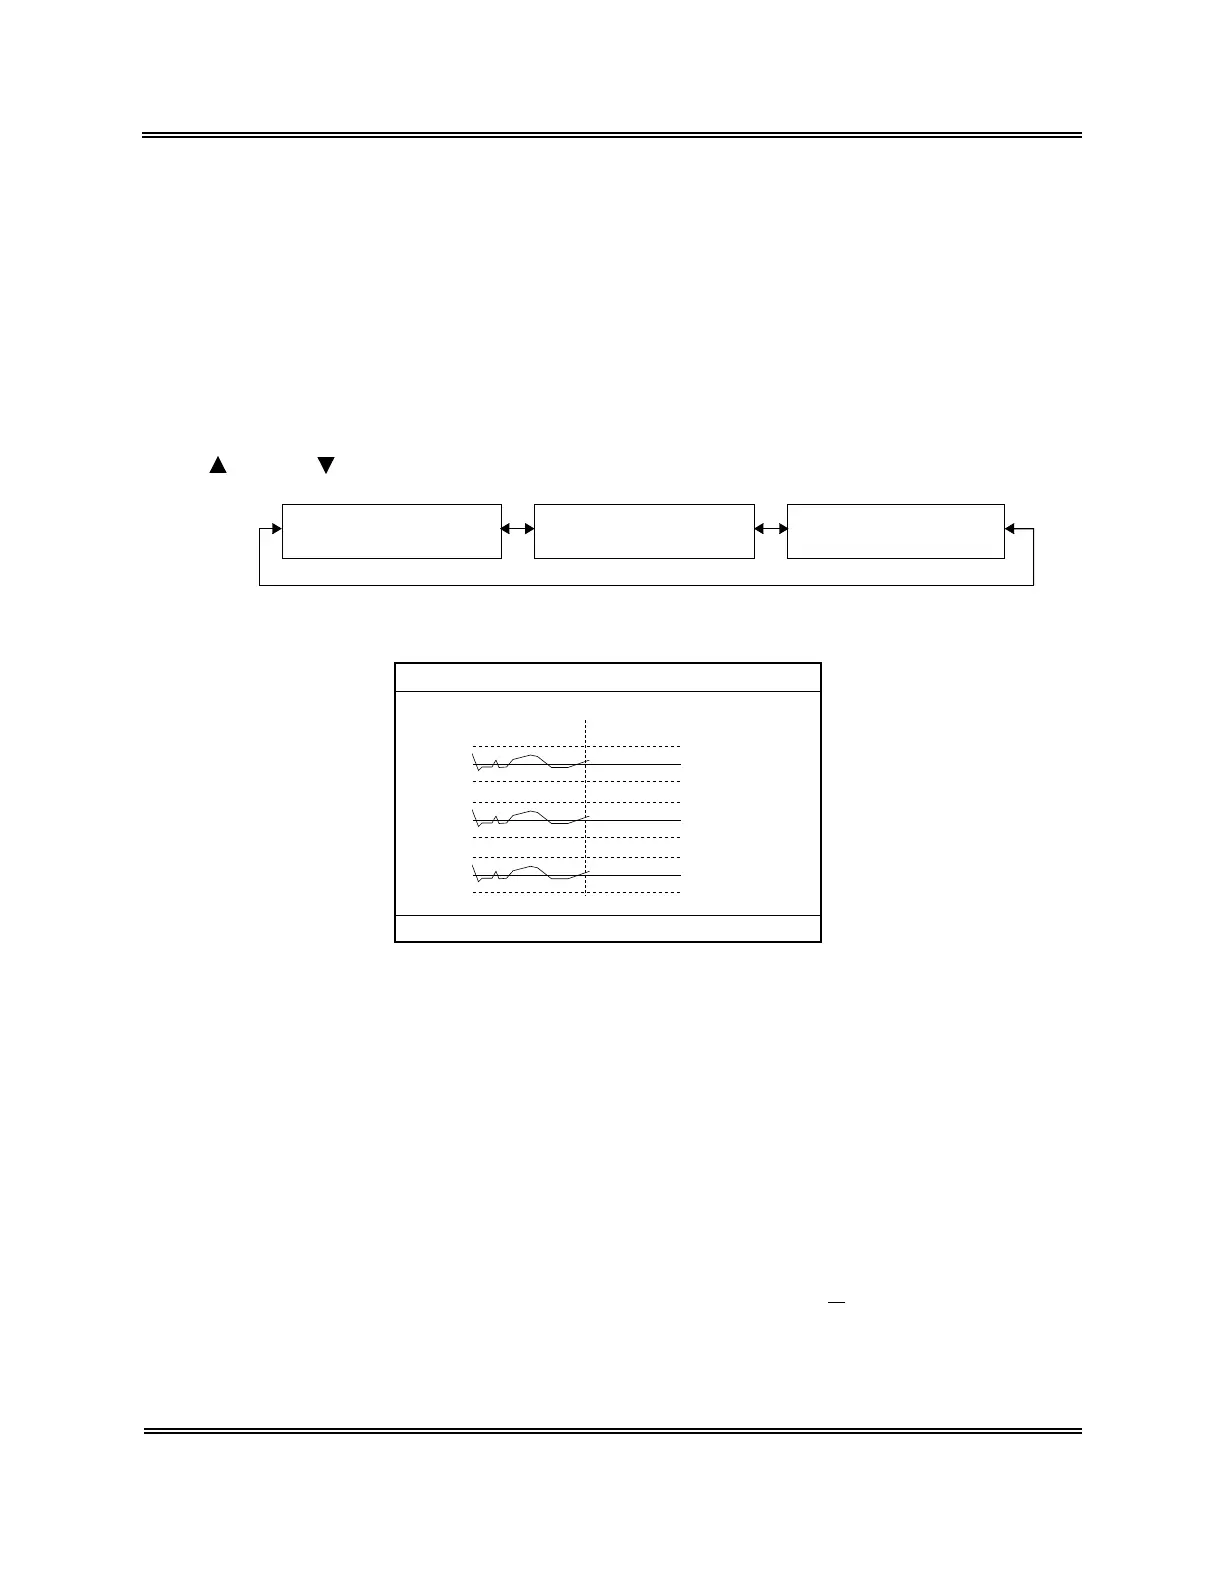
[ ] key or [ ] key can be used to change over the screen.
P2. QC Chart Screen [2/3]
HCT, MCV, MCH
P3. QC Chart Screen [3/3]
MCHC, PLT
P1. QC Chart Screen [1/3]
WBC, RBC, HGB
Figure 5-1-1: Page Selection in QC Chart Screen
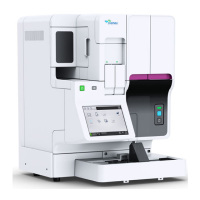
(N=30) 31/12
UL
WBC
RBC
HGB
LL
UL
LL
UL
LL
LIMIT DATA
(MEAN)
8.1
7.6 7.3
7.1( 7.8)
4.70
4.50 4.52
4.30( 4.55)
15.5
15.0 14.8
14.5( 15.0)
FILE No.1
1:QC Analyze 2:Settings 3:Erase All
Figure 5-1-2: QC Chart Screen
The QC Chart screen displays QC data as shown below:
1) FILE No.
FILE No. of QC Chart displayed on the screen
2) Control parameter
Analysis parameters of control data (CBC8 parameters) are displayed on three pages:
QC Chart screen [1/3]: WBC, RBC, HGB
QC Chart screen [2/3]: HCT, MCV, MCH
QC Chart screen [3/3]: MCHC, PLT
3) N
The number of control data plotted currently. In the case of
X
control, the average
represents a data.