DISPLAY AND PROCESSING OF ANALYSIS RESULTS
3-8 Sysmex KX-21 Operator’s Manual -- Revised October 1998
(5) Using [ ] key or [ ] key, move the Discri. position on the Particle Distribution
Chart. The Discri. position relocated is displayed.
The range within which each Discri. position can move is shown below.
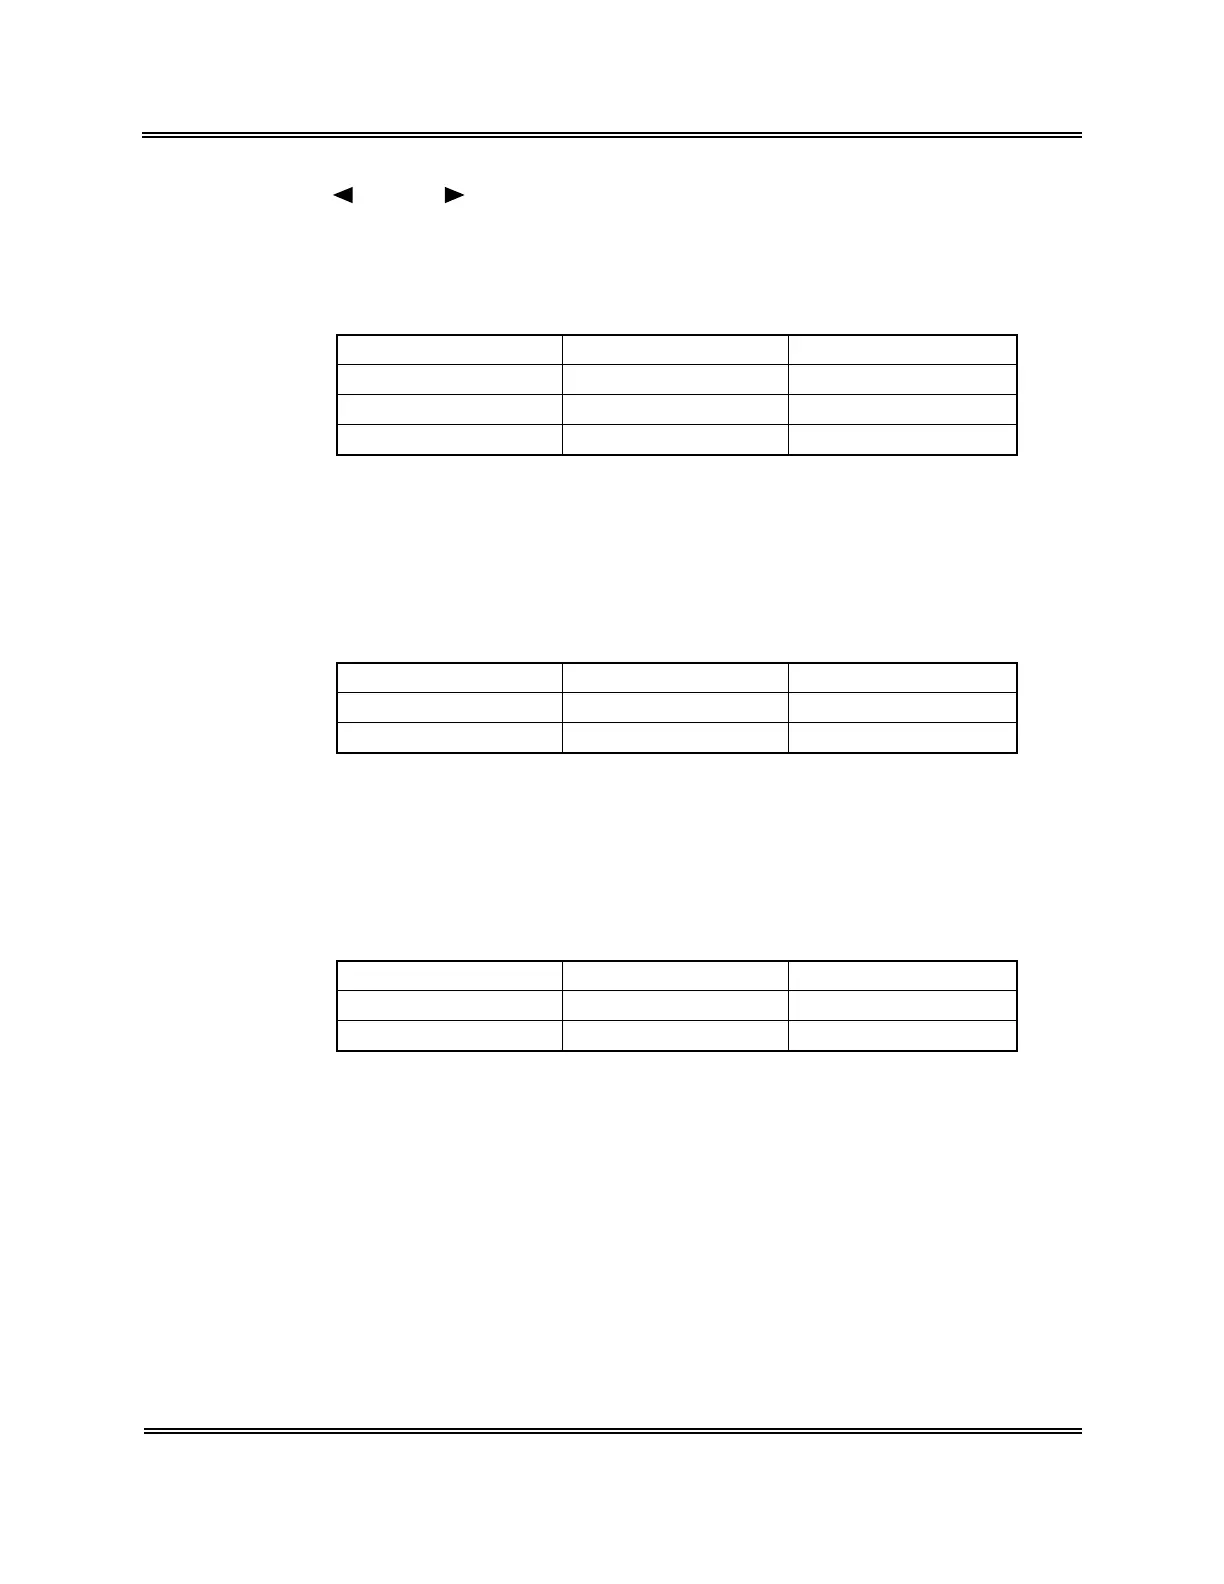
Table 3-2-1: M. Discri. Screen (WBC)
Discri. to Move Lower Limit Upper Limit
LD 6 fL (0ch) T1
T1 LD T2
T2 T1 UD
WBC particle distribution covers 50 channels of 0 to 49 (6 fL per channel), and the
channel changes by one at a time.
The relation between WBC particle distribution channel and fL display is as follows:
Discri. position (fL) = (Channel No. + 1) × 6
Table 3-2-2: M. Discri. Screen (RBC)
Discri. to Move Lower Limit Upper Limit
LD 5 fL (0ch) UD
UD LD 250 fL (49ch)
RBC particle distribution covers 50 channels of 0 to 49 (5 fL per channel), and the
channel changes by one at a time.
The relation between RBC particle distribution channel and fL display is as follows:
Discri. position (fL) = (Channel No. + 1) × 5
Table 3-2-3: M. Discri. Screen (PLT)
Discri. to Move Lower Limit Upper Limit
LD 1 fL (0ch) UD
UD LD 40 fL (39ch)
PLT particle distribution covers 40 channels of 0 to 39 (1 fL per channel), and the
channel changes by one at a time.
The relation between PLT particle distribution channel and fL display is as follows:
Discri. position (fL) = (Channel No. + 1) × 1
(6) After Discri. movement, press [ENTER] key.
The Discri. position is set and analysis data is re-calculated on the basis of new Discri.
position.
When [SELECT] key is pressed without pressing [ENTER] key, the Discri. position is
not changed, and the status returns to the Discri. position selection status.
(7) When you want to change another Discri., repeat the above (2) - (6) operation.
 Loading...