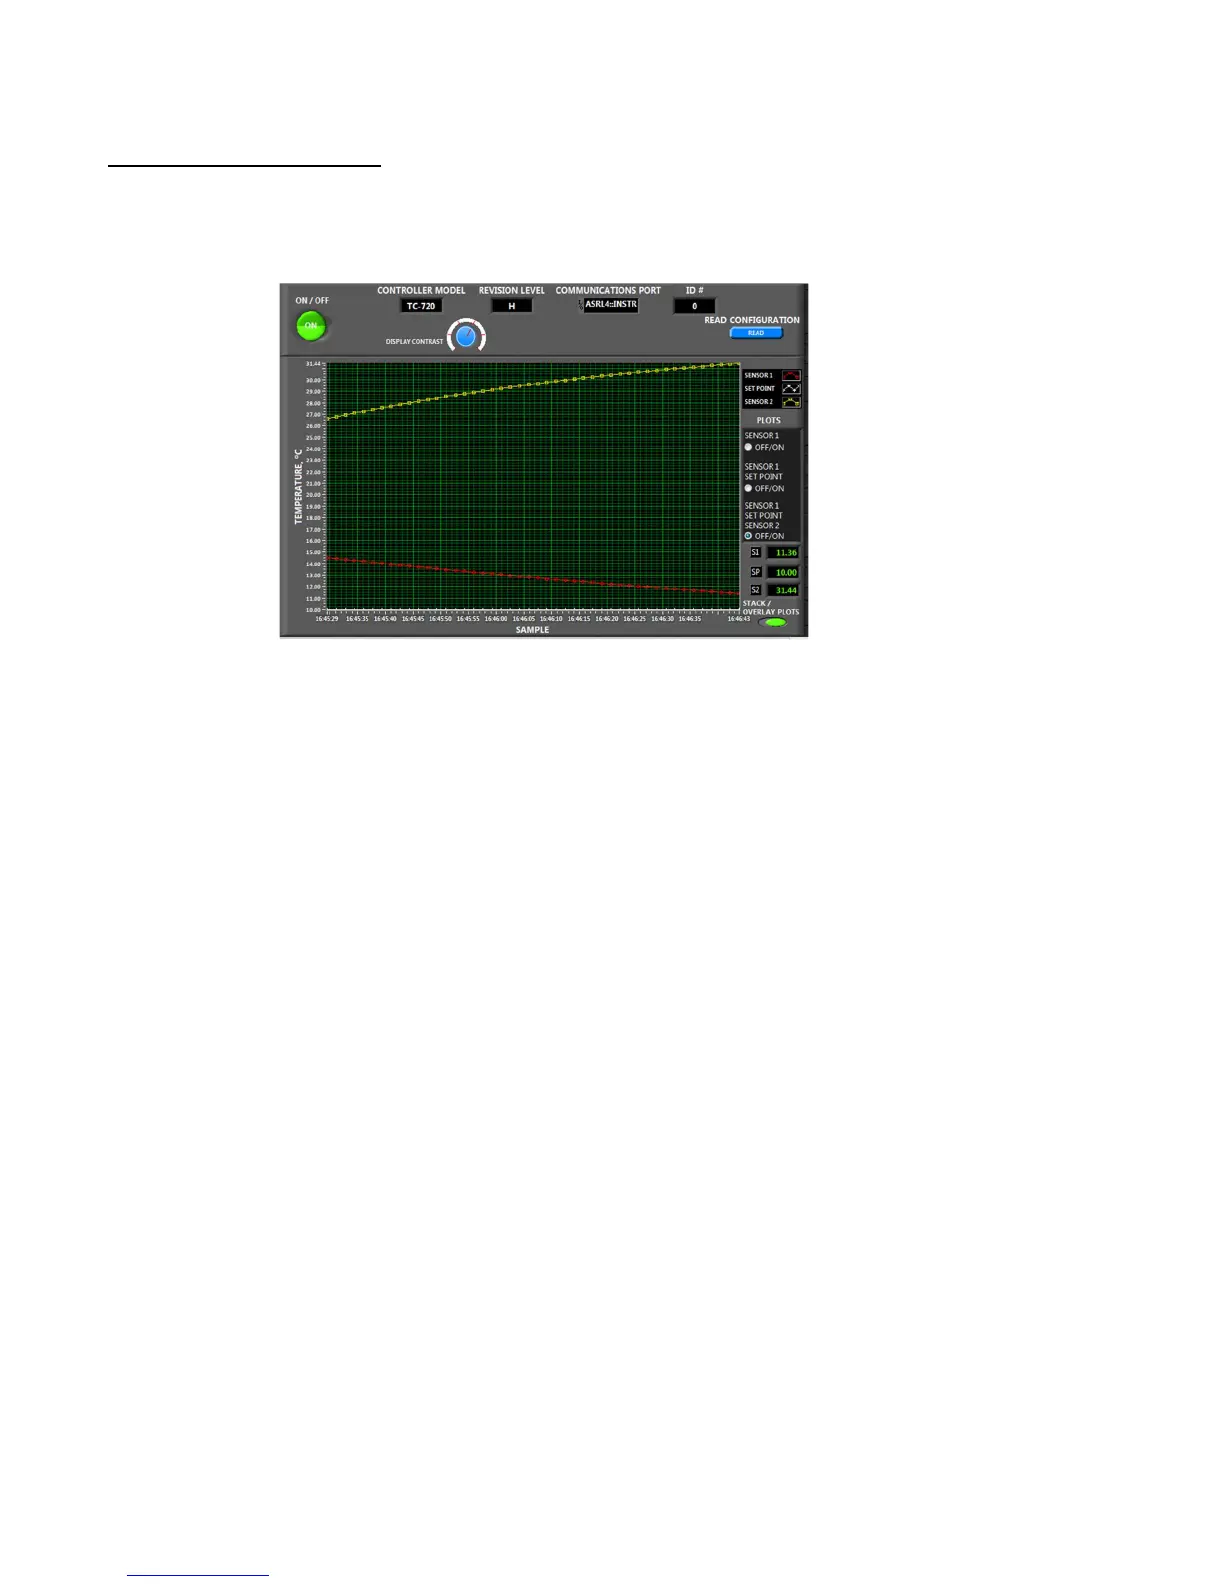
SENSOR AND SET POINT DISPLAY
The sensors and set point values are displayed on a waveform graph. The STACK/OVERLAY PLOTS button toggles between
how the sensors and set point values are displayed. The graph below shows the plots in overlay mode where all the plots
share a common Y-axis.
In the PLOTS section, if SENSOR1 is selected, then only the control sensor is plotted. If SENSOR 1/SET POINT is selected,
then the control sensor and the set point temperature are plotted. Lastly, when SENSOR 1/SET POINT/SENSOR 2 is selected
(as shown in above), the control sensor, set point temperature, and secondary sensory are plotted.
In the graph shown above, the set point temperature was set to 10 °C. This is actually being plotted but the Y-scale starts at
10 °C, so the plot does not show up very well. You can right-click on the Y-axis with the mouse and deselect “AutoScale Y”.
Then you could highlight the number at the bottom of the Y-axis and enter a lower number to more clearly display the plot
if needed.
In the lower right corner of the graph up above the STACK/OVERLAY toggle switch, the current sensor values and set-point
temperature are shown. The S1, or sensor 1, is the control sensor temperature. The SP is set point temperature. S2, or
sensor 2, is the secondary sensor temperature.