Page 24
© Copyright 2008-2012 Energy, Inc. All rights reserved
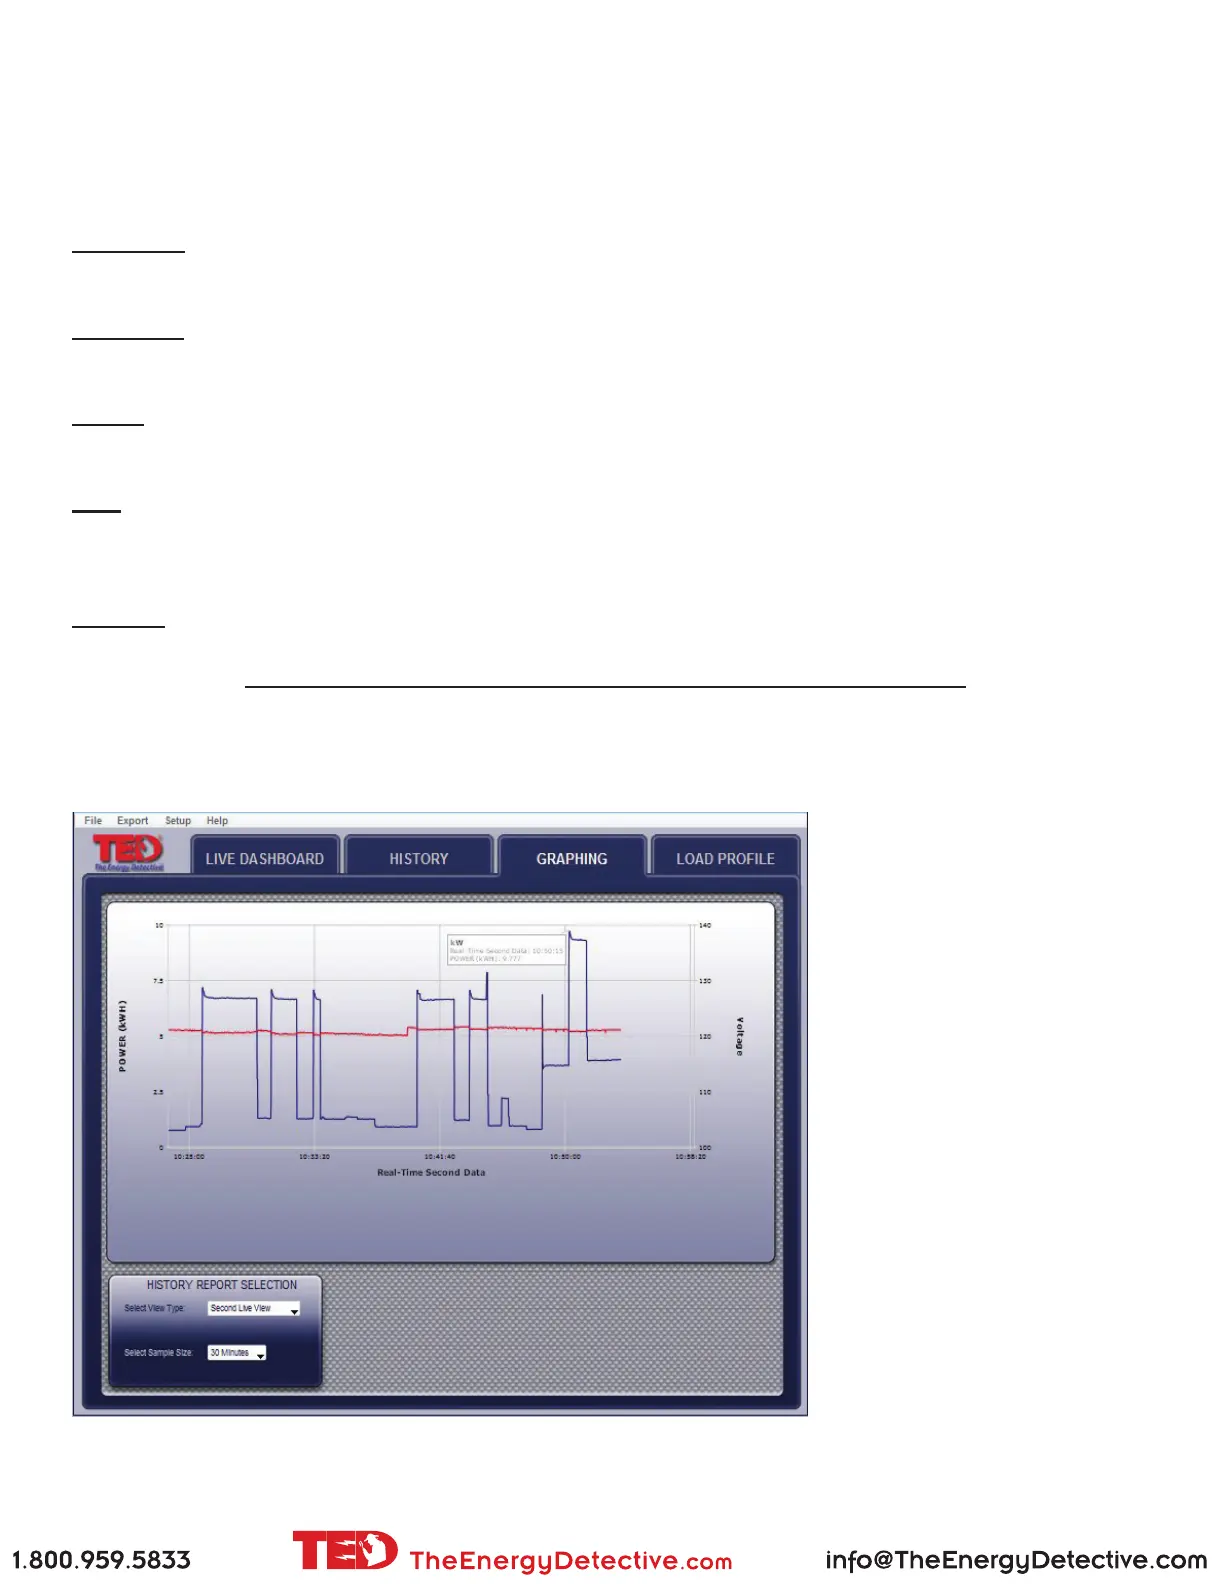
GRAPHING Tab
TED 5000 stores data internally in its Gateway. This data can be retrieved at any time and graphed displayed in
graphic form. The data available for viewing is:
SECONDS - one hour of second-data in increments from Live (real-time) recording, 30-seconds, or 1, 2, 5, 15,
30 and 60 minutes.
MINUTES - 48 hours of minute-data may be displayed in increments from 30 minutes; 1, 2, 4, 12, 24, 36, to 48
hours.
HOUR - 90 days of hourly data are stored. Historical Hourly Data is viewable for any selected date-range
in increments of 7-day periods. Specic Hourly Data can be viewed in kWh, Voltage, or Dollars.
DAY - 2 years of Daily data are stored. Daily Data is viewable for any selected range for the prior 2
years in 90-day periods. Data viewable is: kWh, Dollars, Minimum/Maximum Voltage, Minimum/
Maximum Cost, Minimum/Maximum Power (kW).
MONTH - 10 years of Monthly data are stored. Data viewable is: kWh, Dollars, Minimum/Maximum Voltage,
Minimum/Maximum Cost, Minimum/Maximum Power (kW).
Sample - SECONDS graph of KW - scale selected is 30 seconds
Line colors are user-selectable in
System Setup.
If more than 1 MTU is installed,
or Solar/Wind package installed,
each MTU is displayed layered
or independently.