Page 25
www.theenergydetective.com
Page 25
v.3.3.1
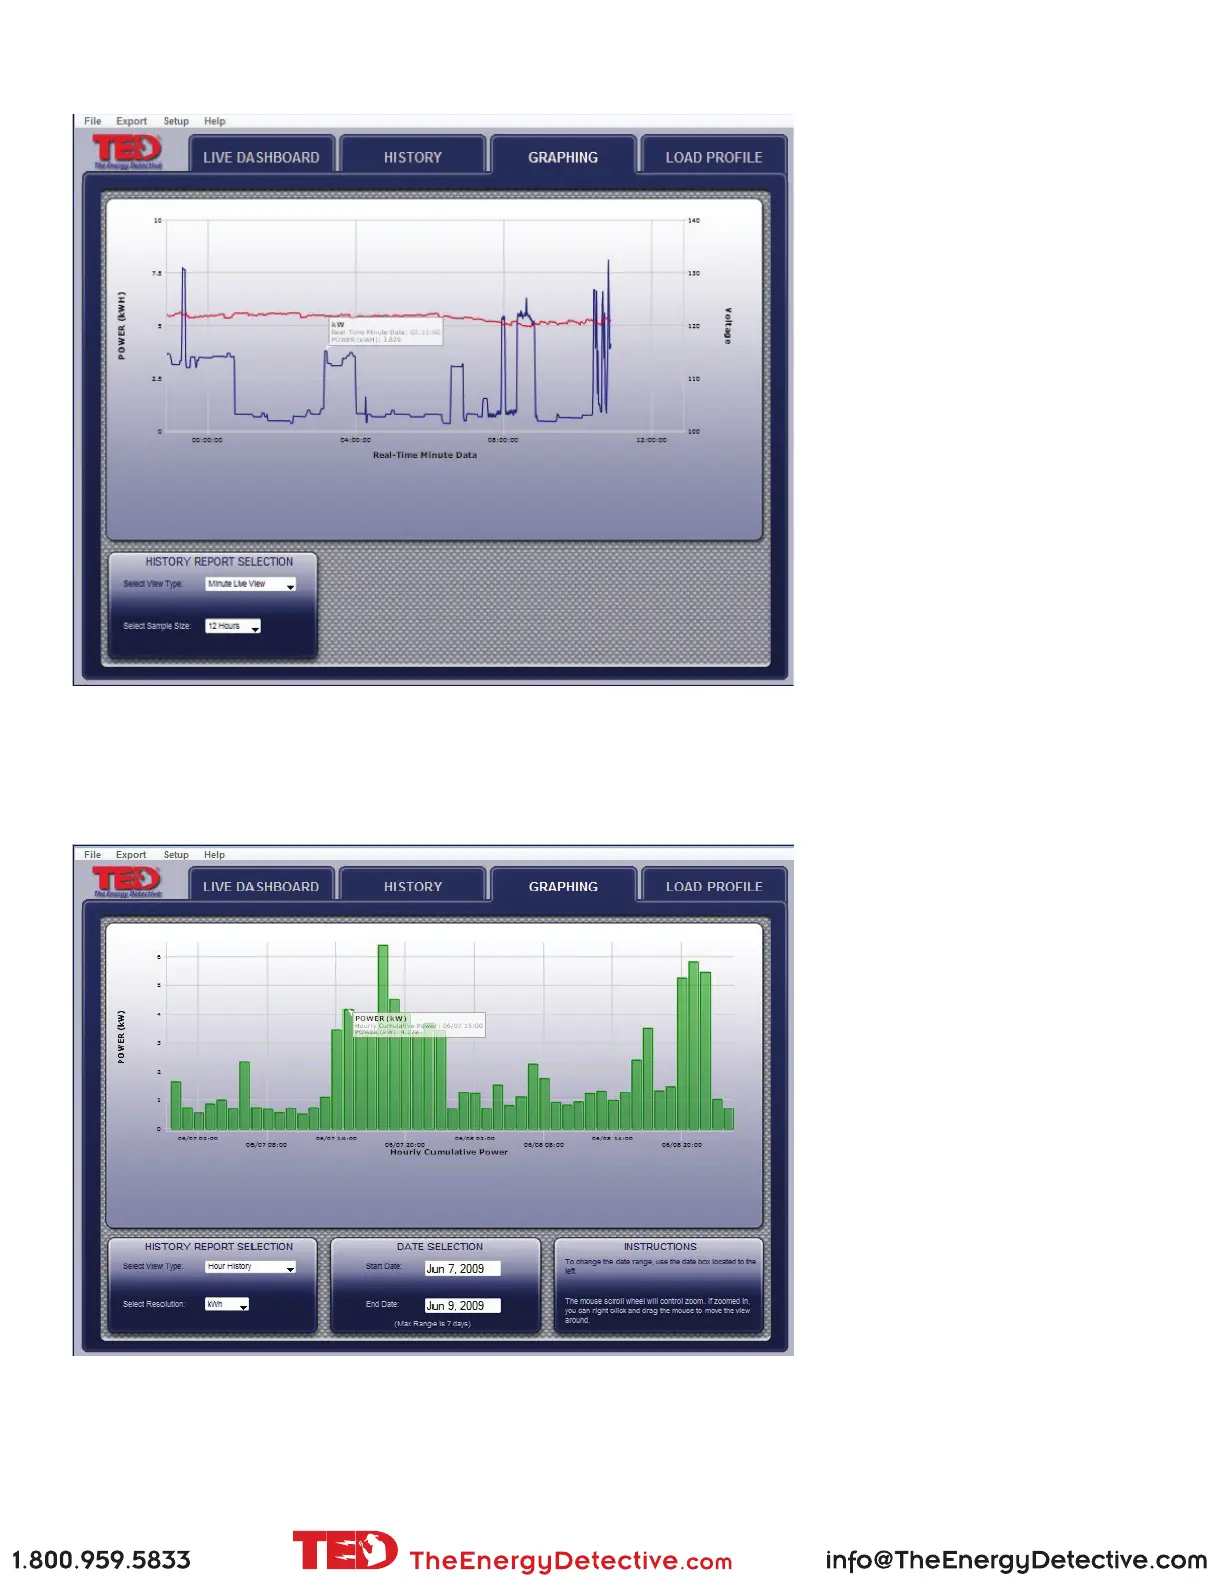
Sample - MINUTE graph of KW- scale selected is 12 Hours
Looking at this graph, you
can immediately see when
the HVAC is on, when
activity begins in the home,
hotwater heater coming on,
etc.
Sample - HOUR graph of kWh - range selected is 2 days
Hovering over any point on any
graph will give the specic detail
of that moment in time.
This is a 2-day view showing the
kWh used each hour of the day.